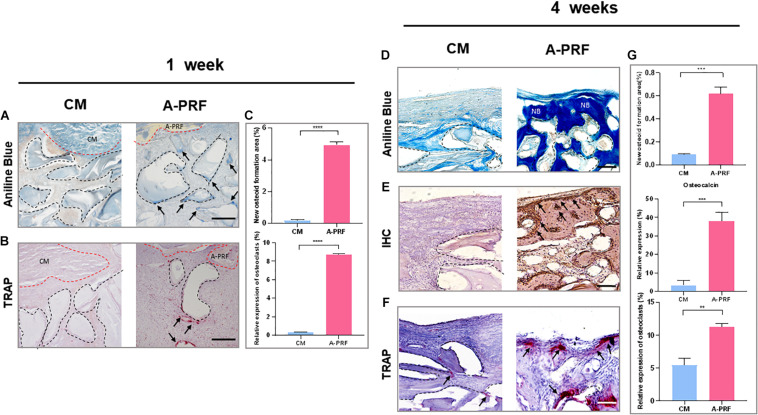
FIGURE 5.
Histological and histomorphometric analysis of new bone formation under SM area at 1 and 4 weeks. (A) Aniline blue staining for assessing new bone formation in group CM and A-PRF at 1 week (blue-stained mineralized tissues were marked with black arrows; black dotted boxes represented DBBM, scale bar: 100 μm). (B) TRAP staining for the osteoclast activity at 1 week (TRAP-positive cells were marked with black arrows, scale bar: 100 μm). (C) Semiquantitative analysis regarding new osteoid formation and the relative expression of osteoclast area at 1 week (n = 3, ****p < 0.0001). Aniline blue staining (D), IHC (E), and TRAP staining (F) were performed to further reveal bone remodeling in group CM and A-PRF at 4 weeks (scale bar: 50 μm). (G) Semiquantitative analysis regarding new osteoid formation, relative expression of osteocalcin, osteoclast area at 4 weeks post-operation (n = 3, **p < 0.01, ***p < 0.001). CM, collagen membrane; A-PRF, advanced platelet-rich fibrin; DBBM, deproteinized bovine bone mineral; NB, new bone.

