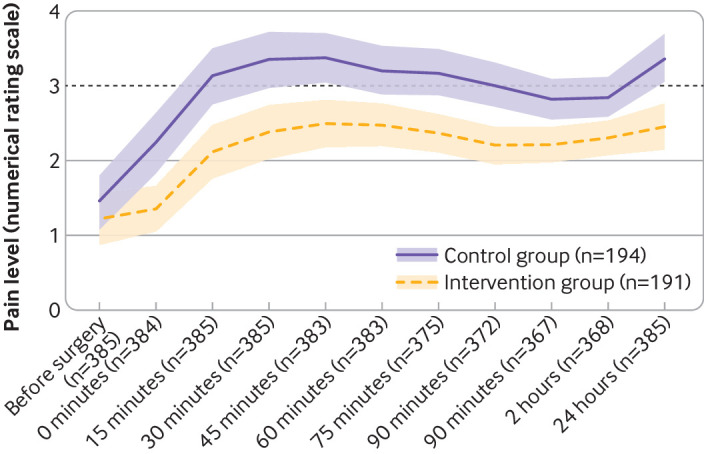
Fig 3.

Course of preoperative and postoperative pain levels. Data are calculated from mean values by bootstrapping owing to non-normally distributed outcome variable. Dashed line represents the numerical rating scale threshold of 3 for pain treatment. Whiskers represent 95% confidence intervals.
