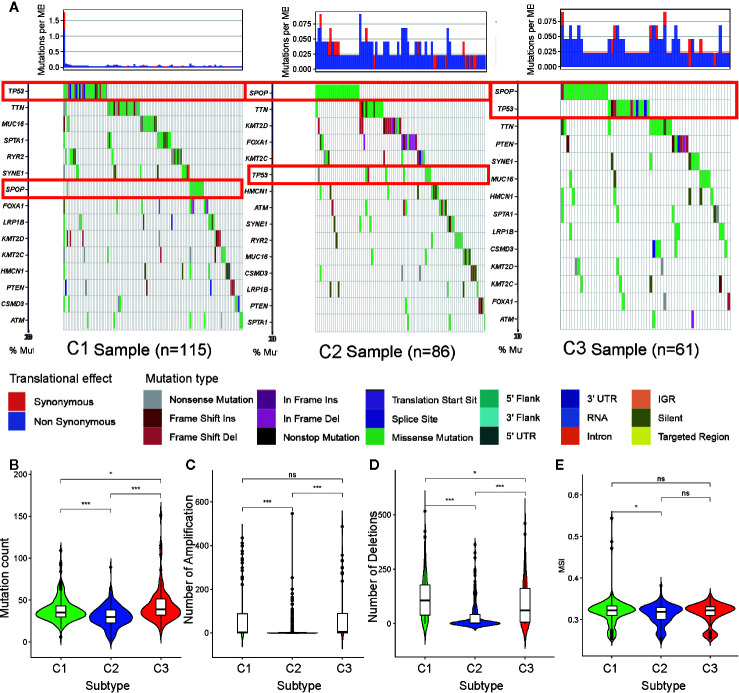
Figure 5.
Association between metabolism-associated subtypes and DNA mutation and copy number variation. (A) The waterfall plot of the top 15 genes of DNA mutation in three subtypes. The pairwise comparison of the mutation count (B), the number of amplification (C), the number of deletions (D), and MSI (E) between three subtypes. The P values are labeled above each boxplot with asterisks (ns represents no significance, *P < 0.05, **P < 0.01, ***P < 0.001).

