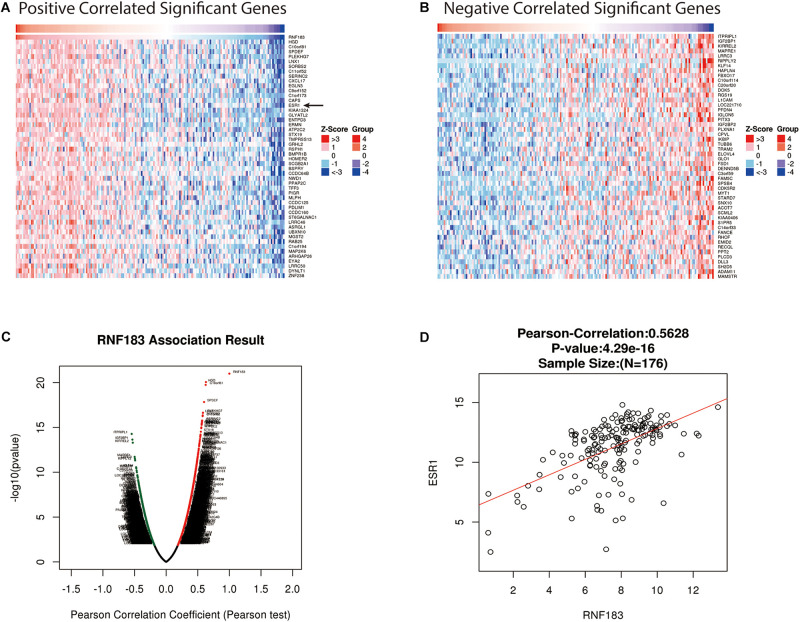
FIGURE 3.
Genes differentially expressed in correlation with RNF183 in UCEC (LinkedOmics). (A–B) Heat maps showing genes positively and negatively correlated with RNF183 in UCEC (TOP 50). (C) A Pearson test was used to assess correlations between RNF183 and genes differentially expressed in UCEC. Red indicates positively correlated genes and green indicates negatively correlated genes. (D) The scatter plot shows the Pearson correlation of RNF183 expression with ESR1.

