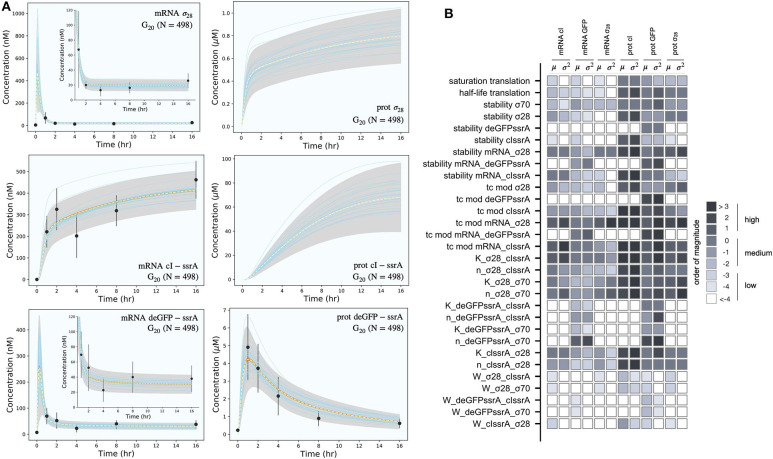
Figure 3.
Model simulations vs. experimental measurements for the negative feedback deGFP-ssrA circuit. (A): Model simulations of the negative feedback deGFP-ssrA circuit using the G20 ensemble (N = 498). Uncertainty: Simulations and uncertainty quantification are shown for the generation 20 (G20) ensemble which yielded N = 489 parameter sets (rank two or below). The parameter ensemble was used to calculate the mean (dashed line) and the 99% confidence estimate of the simulation (gray region). Additionally, the 99% confidence estimate of the mean simulation is shown in orange. Individual parameter set trajectories are also shown in blue. Points denote the mean experimental measurement while error bars denote the 95% confidence estimate of the experimental mean computed from at least three replicates. (B): Global sensitivity analysis of the negative feedback deGFP-ssrA circuit parameters. Morris sensitivity coefficients were calculated for the unknown model parameters, where the range for each parameter was established from the ensemble.

