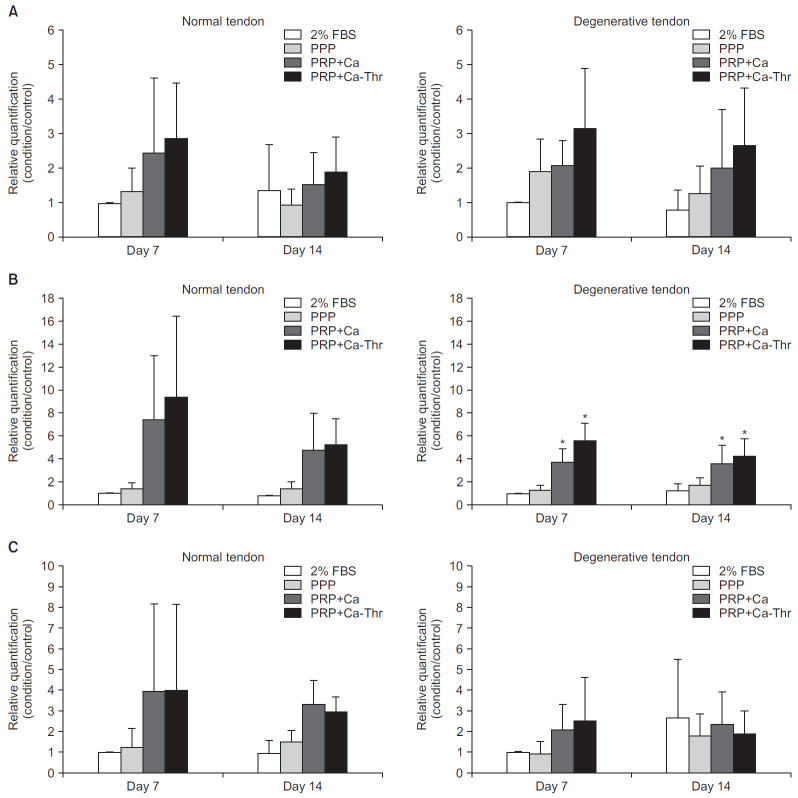
Fig. 3.
Gene expression levels of type I and III collagen measured by real-time reverse transcriptase polymerase chain reaction. Relative quantifications were calculated by dividing the mRNA expression level in cells treated with platelet-rich plasma (PRP) by that in control cells. (A) Type I collagen. (B) Type III collagen. (C) The ratio of the gene expression of type III to I collagen.
FBS: fetal bovine serum, PPP: platelet-poor plasma, PRP-Ca: PRP activated with calcium, PRP-Ca-Thr: PRP activated with calcium and thrombin.
*Statistical significance at the level of p<0.001.

