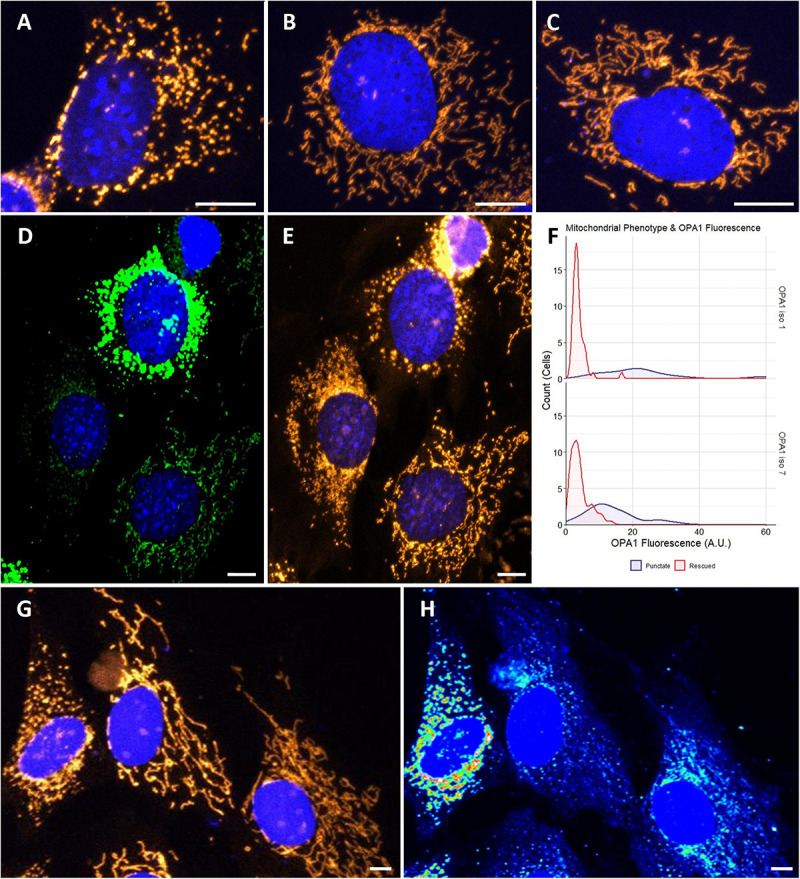
FIGURE 2.

Cytological analysis of OPA1 iso 1 and 7 transient expression. (A–C) Show the mitochondrial network of representative OPA1–/– cells, or transiently transfected OPA1–/– with either OPA1 iso 1 or 7 plasmid, respectively. (D) A representative image of cells showing widely varying levels of HIS-tagged OPA1 expression. (E) Shows that these cells also exhibit distinct mitochondrial phenotypes. (F) Cells were grouped by mitochondrial phenotype, demonstrating either punctate (purple) or rescued (red) mitochondria, and the OPA1 fluorescence levels were measured. Only cells that exhibited measurable OPA1 fluorescence were included for this analysis. The two mitochondrial phenotypes demonstrate significantly distinct distributions of OPA1 fluorescence (n > 50 cells for each group from 15 FOV over 3 separate transfections, p < 0.0001, Wilcoxon rank sum test). (G,H) Representative wild type NIH-3T3 MEF cells transfected with OPA1 iso 7. Mitotracker staining in (G) demonstrates the gross morphology differences observed with (H) showing a heat map of HIS-tagged OPA1 iso 7 protein signal in these cells. This morphological change in the mitochondrial network is seen with OPA1 iso 1 transfection also. Red scale bar = 10 μm.
