
FIGURE 3.
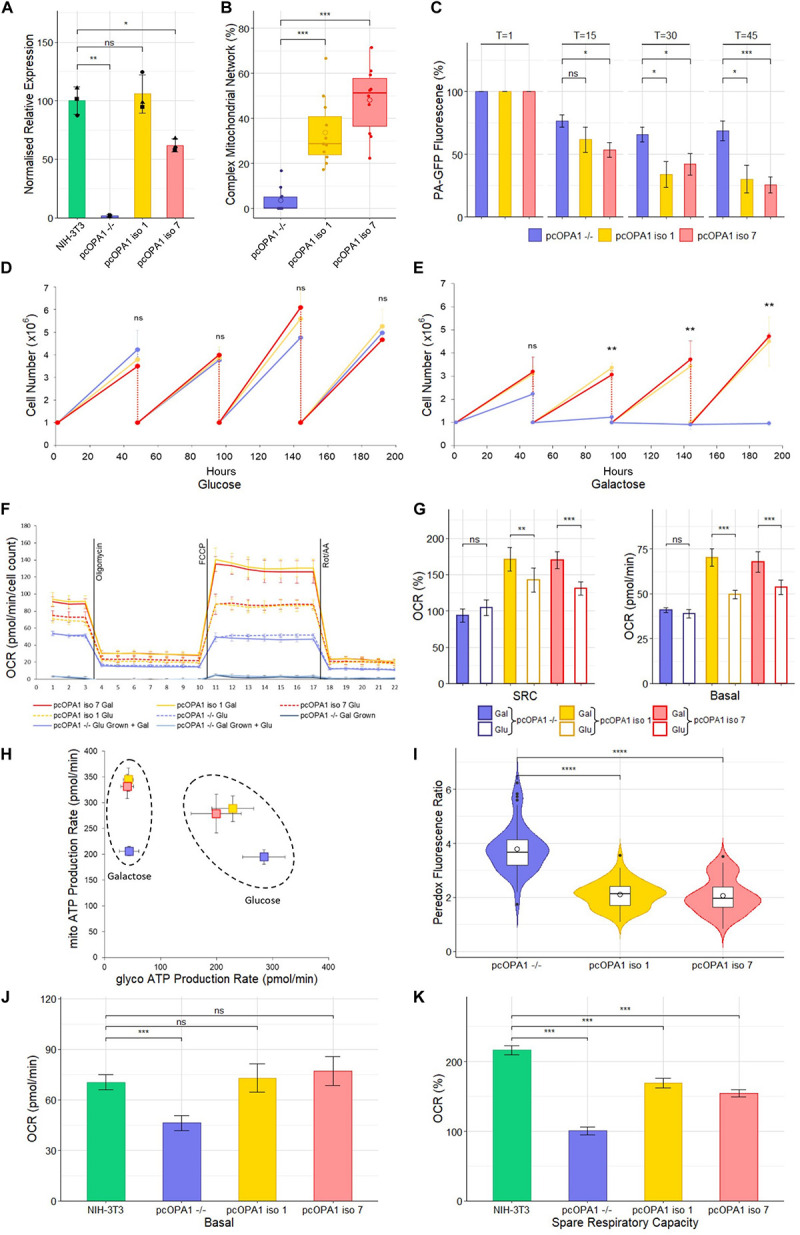
Biochemical analysis of pcOPA1 iso 1 (yellow) and pcOPA1 iso 7 (red) stable cells compared to pcOPA1–/– (purple) stable cells and wild type NIH-3T3 MEFs (green). (A) Western blot densitometry analysis of pcOPA1 iso 1, iso 7, and –/– stable cell lines relative to NIH-3T3 cells. Values have been normalized to β-actin. The •, ▲, and ■ symbols represent samples taken 1, 7, and 14 days apart, demonstrating little variation in protein expression levels over time. (n = 3 replicates of each cell type and n = 4 technical replicates, error bars ± SD). (B) Morphological analysis of mitotracker stained mitochondria showing proportion of cells that showed evidence of complex mitochondrial structure (n = 10 random FOV across 3 independent trials). (C) Mitochondrial Fission Analysis. PA-GFP fluorescence as a percentage of T = 1 measured at 15, 30, and 45 min post illumination (n = 10 cells from 5 FOV, error bars ± SE) Rescued cells show a significant improvement in the rate of mitochondrial fusion compared to pcOPA1–/– cells. (D,E) show growth curves of each stable cell line with either glucose or galactose as their primary energy source (n = 3 independent trials). (F) Seahorse XFe96 Mitochondrial Stress Test of the stable cell lines under different growth conditions. Solid lines represent cells grown in 10 mM galactose, hatched lines represent cells grown in 25 mM glucose media for 48 h prior to the experiment (n = 8 replicates each group, normalized to cell count, error bars ± SD). (G) Shows the basal OCR and SRC as a% of basal OCR from F), (n = 8 replicates each group, normalized to cell count, error bars ± SE) Taken together (F,G) demonstrate that pcOPA1 iso 1 and 7 cells glucose showed an increase in both basal and SRC when compared to pcOPA1–/– cells grown in glucose. Furthermore, when pcOPA1 iso 1 or 7 cells were grown in galactose they outperform pcOPA1 iso 1 and 7 cells grown in glucose, suggesting improved ability to remodel mitochondria to meet metabolic demands. (H) The ATP Rate Assay demonstrates that pcOPA1 iso 1 and 7 cells can utilize their mitochondria more when forced to do so in galactose media, and favor mitochondrial ATP production more even when grown in glucose. (n = 8 replicates, error bars ± SD). (I) Peredox analysis suggest a significant decrease in cytosolic NADH levels in glucose grown pcOPA1 iso 1 and 7 cells suggesting less reliance on glycolysis for ATP production. (n = 60 cells across 3 separate transfections). (J,K) Seahorse XFe96 data for pcOPA1 iso 1 and 7 and control compared to wild type NIH-3T3 MEF cells. Both pcOPA1 isoform expressing cells show basal OCR rescue to wild type levels, but do not fully restore SRC. (n = 8 replicates per group, normalized to cell count, error bars ± SD). All statistical comparisons are Kruskal-Wallis with post hoc pairwise Wilcoxon rank sum test with BH correction, *p < 0.05, **p < 0.01, ***p < 0.001, ****p < 0.0001