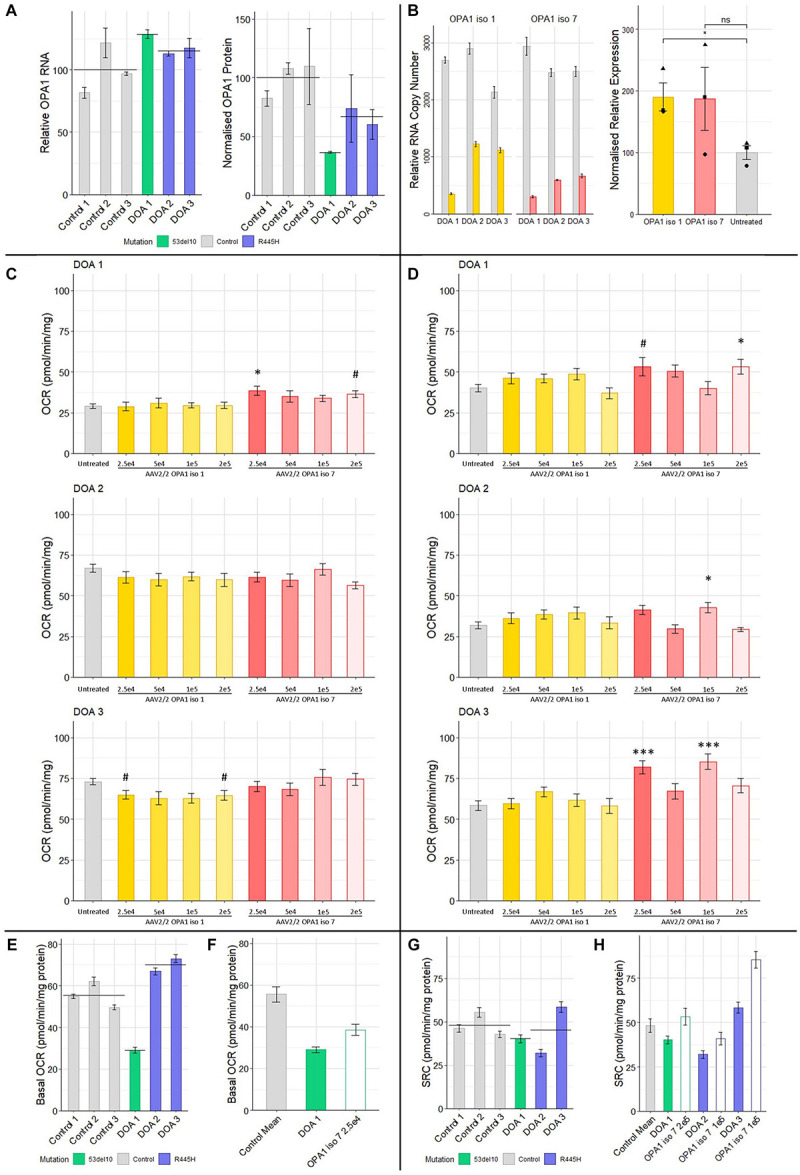
FIGURE 5.

(A) Protein and RNA analysis of 3 DOA fibroblast lines (het 53del10: green and het R445H: purple) and 3 control fibroblast lines (gray). RNA (n = 4 technical replicates) and protein (n = 4 technical replicates) levels are relative to the mean of control samples. (B) RNA and protein analysis from patient cells treated with 1 × 10⁵ MOI of AAV-OPA1 iso 1 or 7. RNA samples are relative copy numbers for each construct (n = 4 technical replicates) and compare endogenous RNA from all OPA1 isoforms (gray) and transduced OPA1 iso 1 (yellow) or 7 (red) RNA. Densitometry analysis of transduced cells is normalized to the untreated mean for all 3 patient cell lines and shows the mean of all three cell lines for a given treatment (n = 3 replicates per cell line, •, ▲, and ■ represent DOA 1, 2, and 3, respectively). (C) Basal OCR and (D) SRC analysis of three DOA patient derived fibroblast lines, DOA 1 (het 53del10) DOA 2 (het R445H) and DOA 3 (het R445H), grown in galactose either untreated (gray) or treated with four MOIs of either AAV2/2-OPA1 iso 1 (yellow shades) or AAV2/2-OPA1 iso 7 (red shades) 48 h prior to analysis (Seahorse XFe96). OCR was normalized to protein content. SRC was measured as the difference between basal and maximal OCR after removal of non-mitochondrial OCR. (n = 3 replicates, Dunnett’s Test vs. Untreated). (E) Comparison of the basal OCR of 3 control fibroblast cell lines with the 3 patient cell lines untreated, color coded by mutation (n = 3 replicates). (F) Comparison of the mean control basal OCR and the only dose found to significantly alter basal OCR from C), 2.5 × 10⁴ MOI AAV-OPA1 iso 7 in DOA 1 cells. (G) SRC of control cell lines compared to DOA cell lines, color coded by mutation (n = 3 replicates). (H) Comparison of the mean SRC of the 3 control lines with untreated DOA SRC values and the viral doses that achieved the largest increase in SRC for each from (D) [outlined bars (n = 3 replicates)]. #p < 0.1, ∗p < 0.05, ∗∗∗p < 0.001, error bars ± SE.
