FIGURE 2.
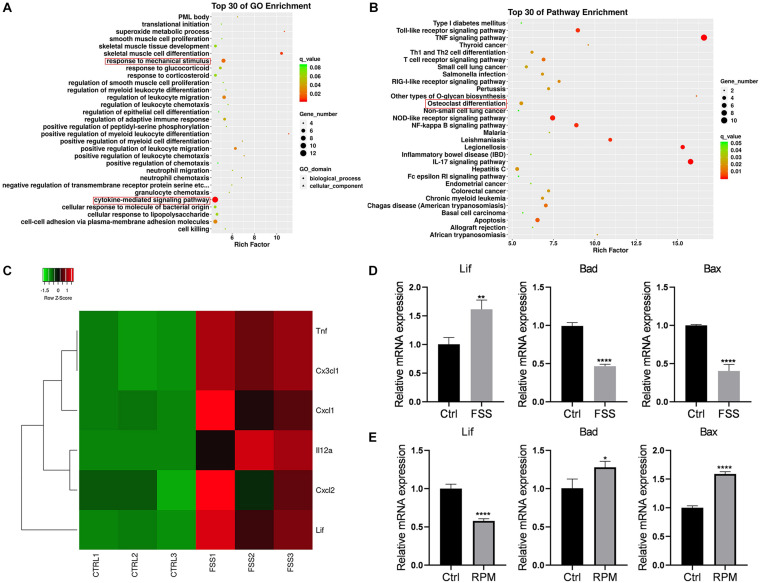
LIF expression in the FSS or microgravity-treated MLO-Y4 cells (A) GO and (B) KEGG pathway enrichment analyses were performed. (C) Heatmap of the expression levels of various cytokines based on the RNA sequencing results is shown. (D) LIF expression was increased under FSS, as determined by RT-PCR. (E) LIF expression was reduced in the microgravity environment, as determined by RT-PCR. All data are shown as means ± standard deviations (n = 3), *p < 0.05, **p < 0.01, ***p < 0.005 and ****p < 0.001.

