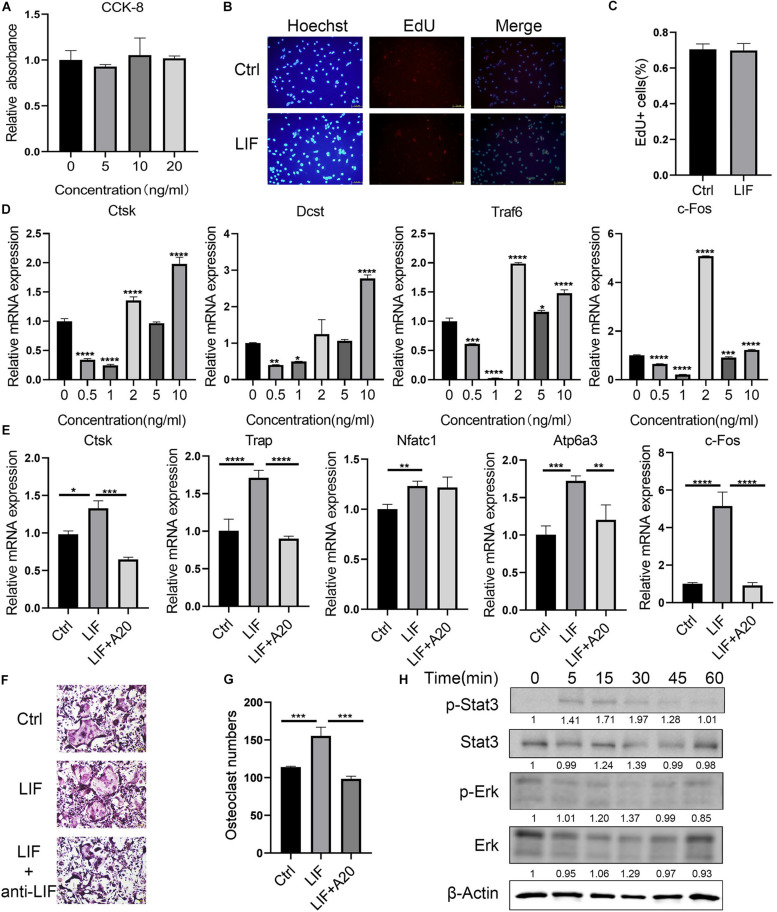
FIGURE 3.
LIF promotes BMM differentiation into osteoclasts (A) LIF, at different concentrations, did not affect BMM proliferation, as shown by the OD value calculated during CCK-8 analysis. (B) BMM cells were treated with LIF (10 ng/mL) for 24 h, and then EdU assay was performed. (C) EdU-positive cells were counted. (D) BMM cells were treated with LIF at different concentrations, and then osteoclast-related genes were detected. (E) RT-PCR results showed that LIF promoted osteoclast-related gene expression. (F) Representative images of TRAP staining of osteoclasts are shown. (G) The number of osteoclasts in each well (96-well plate) and all the cells with ≥3 nuclei were counted. (H) After treatment with LIF at different times, STAT3 and p-STAT3 protein levels in BMMs were determined by western blot analysis. All data are shown as the mean ± SD (n = 3); *p < 0.05, **p < 0.01, ***p < 0.005 and ****p < 0.001.

