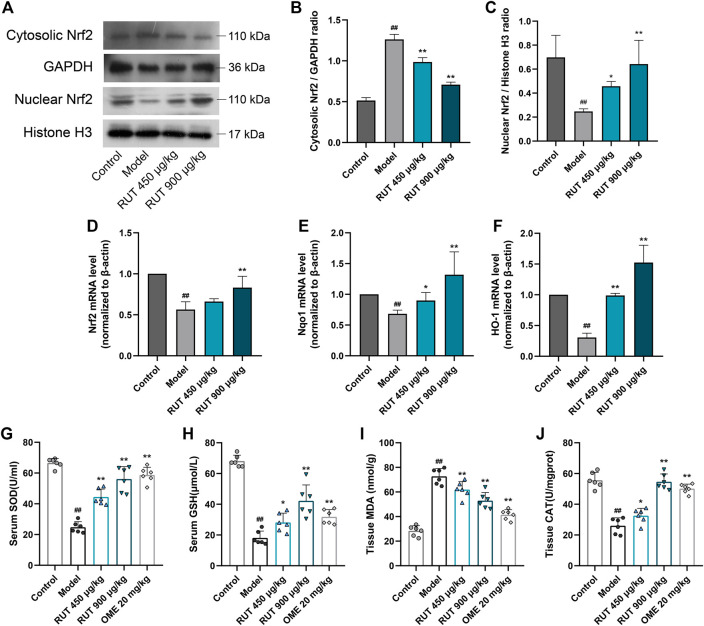
FIGURE 5.
Effect of RUT on oxidative stress factors levels in gastric damage induced by ethanol. Note: (A) Western blot images of cytosolic and nuclear Nrf2; (B) Cytosolic Nrf2 protein level; (C) Nuclear Nrf2 protein level; (D) Nrf2 mRNA level; (E) Nqo1 mRNA level; (F) HO-1 mRNA level; (G) Serum SOD level; (H) Serum GSH level; (I) Tissue MDA level. Values are expressed as mean ± SD (n = 6). #p < 0.05 and ##p < 0.01 when compared with the control group. *p < 0.05 and **p < 0.01 when compared with the model group.

