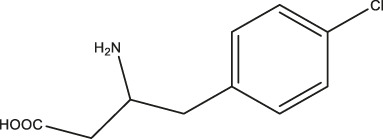
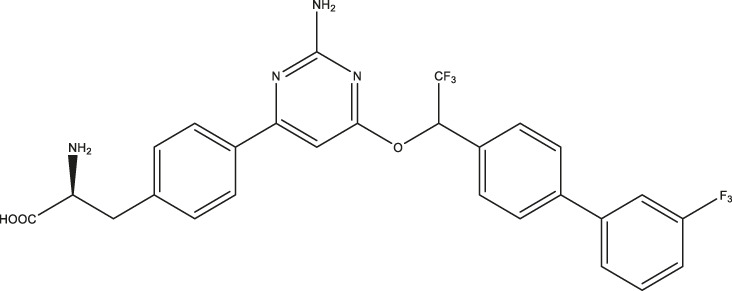
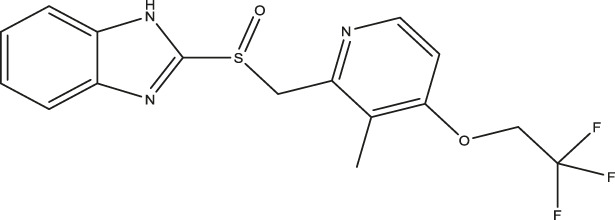
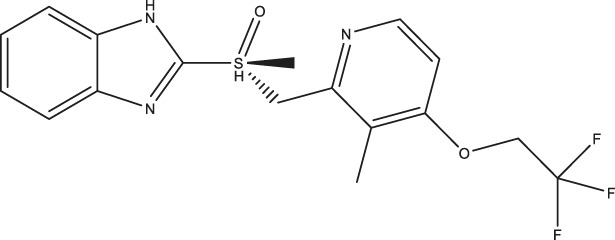
TABLE 1.
Inhibitory activities of omeprazole and its analogues at TPH1 and TPH2, and MAO-A. 1% DMSO was included as a vehicle control.
| Name | Structure | TPH1 IC50/µM | TPH2 IC50/µM | MAO-A IC50/µM |
|---|---|---|---|---|
| pCPA |

|
11.25 (7.11–17.84) | 5.34 (3.23–8.19) | — |
| LP533401 |

|
0.41 (0.31–0.53) | 0.08 (0.05–0.13) | — |
| Omeprazole |

|
3.09 (2.53–3.77) | 4.30 (2.78–6.87) | 89.42 (57.48–141.4) |
| Esomeprazole |

|
3.76 (3.02–4.67) | 2.15 (1.62–2.85) | 17.97 (9.15–34.65) |
| Tenatoprazole |

|
2.16 (1.80–2.60) | 4.90 (3.61–6.73) | 29.18 (18.02–48.17) |
| Rabeprazole |

|
7.57 (5.47–10.56) | 2.13 (1.52–3.01) | 12.80 (8.02–20.6) |
| Pantoprazole |

|
21.68 (9.67–51.83) | 8.20 (5.42–12.56) | 461.9 (271.0–908.5) |
| Lansoprazole |

|
24.60 (18.43–33.25) | 5.21 (3.19–8.56) | 250.7 (159.4–415.9) |
| (R)-lansoprazole |

|
18.80 (14.81–24.04) | 3.36 (1.18–8.96) | 137.3 (90.83–211.8) |
| Ilaprazole |

|
0.83 (0.64–1.8) | 0.53 (0.39–0.73) | 28.96 (17.16–49.08) |
IC50 inhibitory concentration (μM) are shown for omeprazole and its analogues. pCPA and LP 533401 were used as reference compounds for TPH1 and TPH2 inhibition. Data represent means of three independent experiments, each performed in duplicate. Values in brackets represent 95% confidence intervals.
