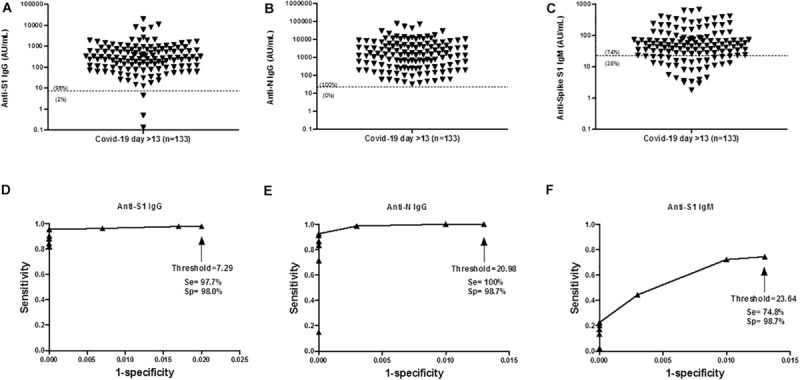
FIGURE 2.

Antibody response to SARS-CoV-2 at day > 13 post infection. (A) Anti-S1 IgG (median = 276 AU/mL), (B) Anti-N IgG (median = 1,434 AU/mL), (C) Anti-S1 IgM level (median = 48 AU/mL). Numbers in parenthesis indicate the percentages of data above and below the threshold. (D–F) Receiver Operating Characteristic (ROC) curve of ALBIA-IgG-S1, ALBIA-IgG-N and ALBIA-S1-IgM. The dotted line indicates the threshold value of ‘mean + 3 standard deviations (M + 3SD)’ of the control distribution. D, day post-symptoms. Se: Sensitivity and Sp: specificity.
