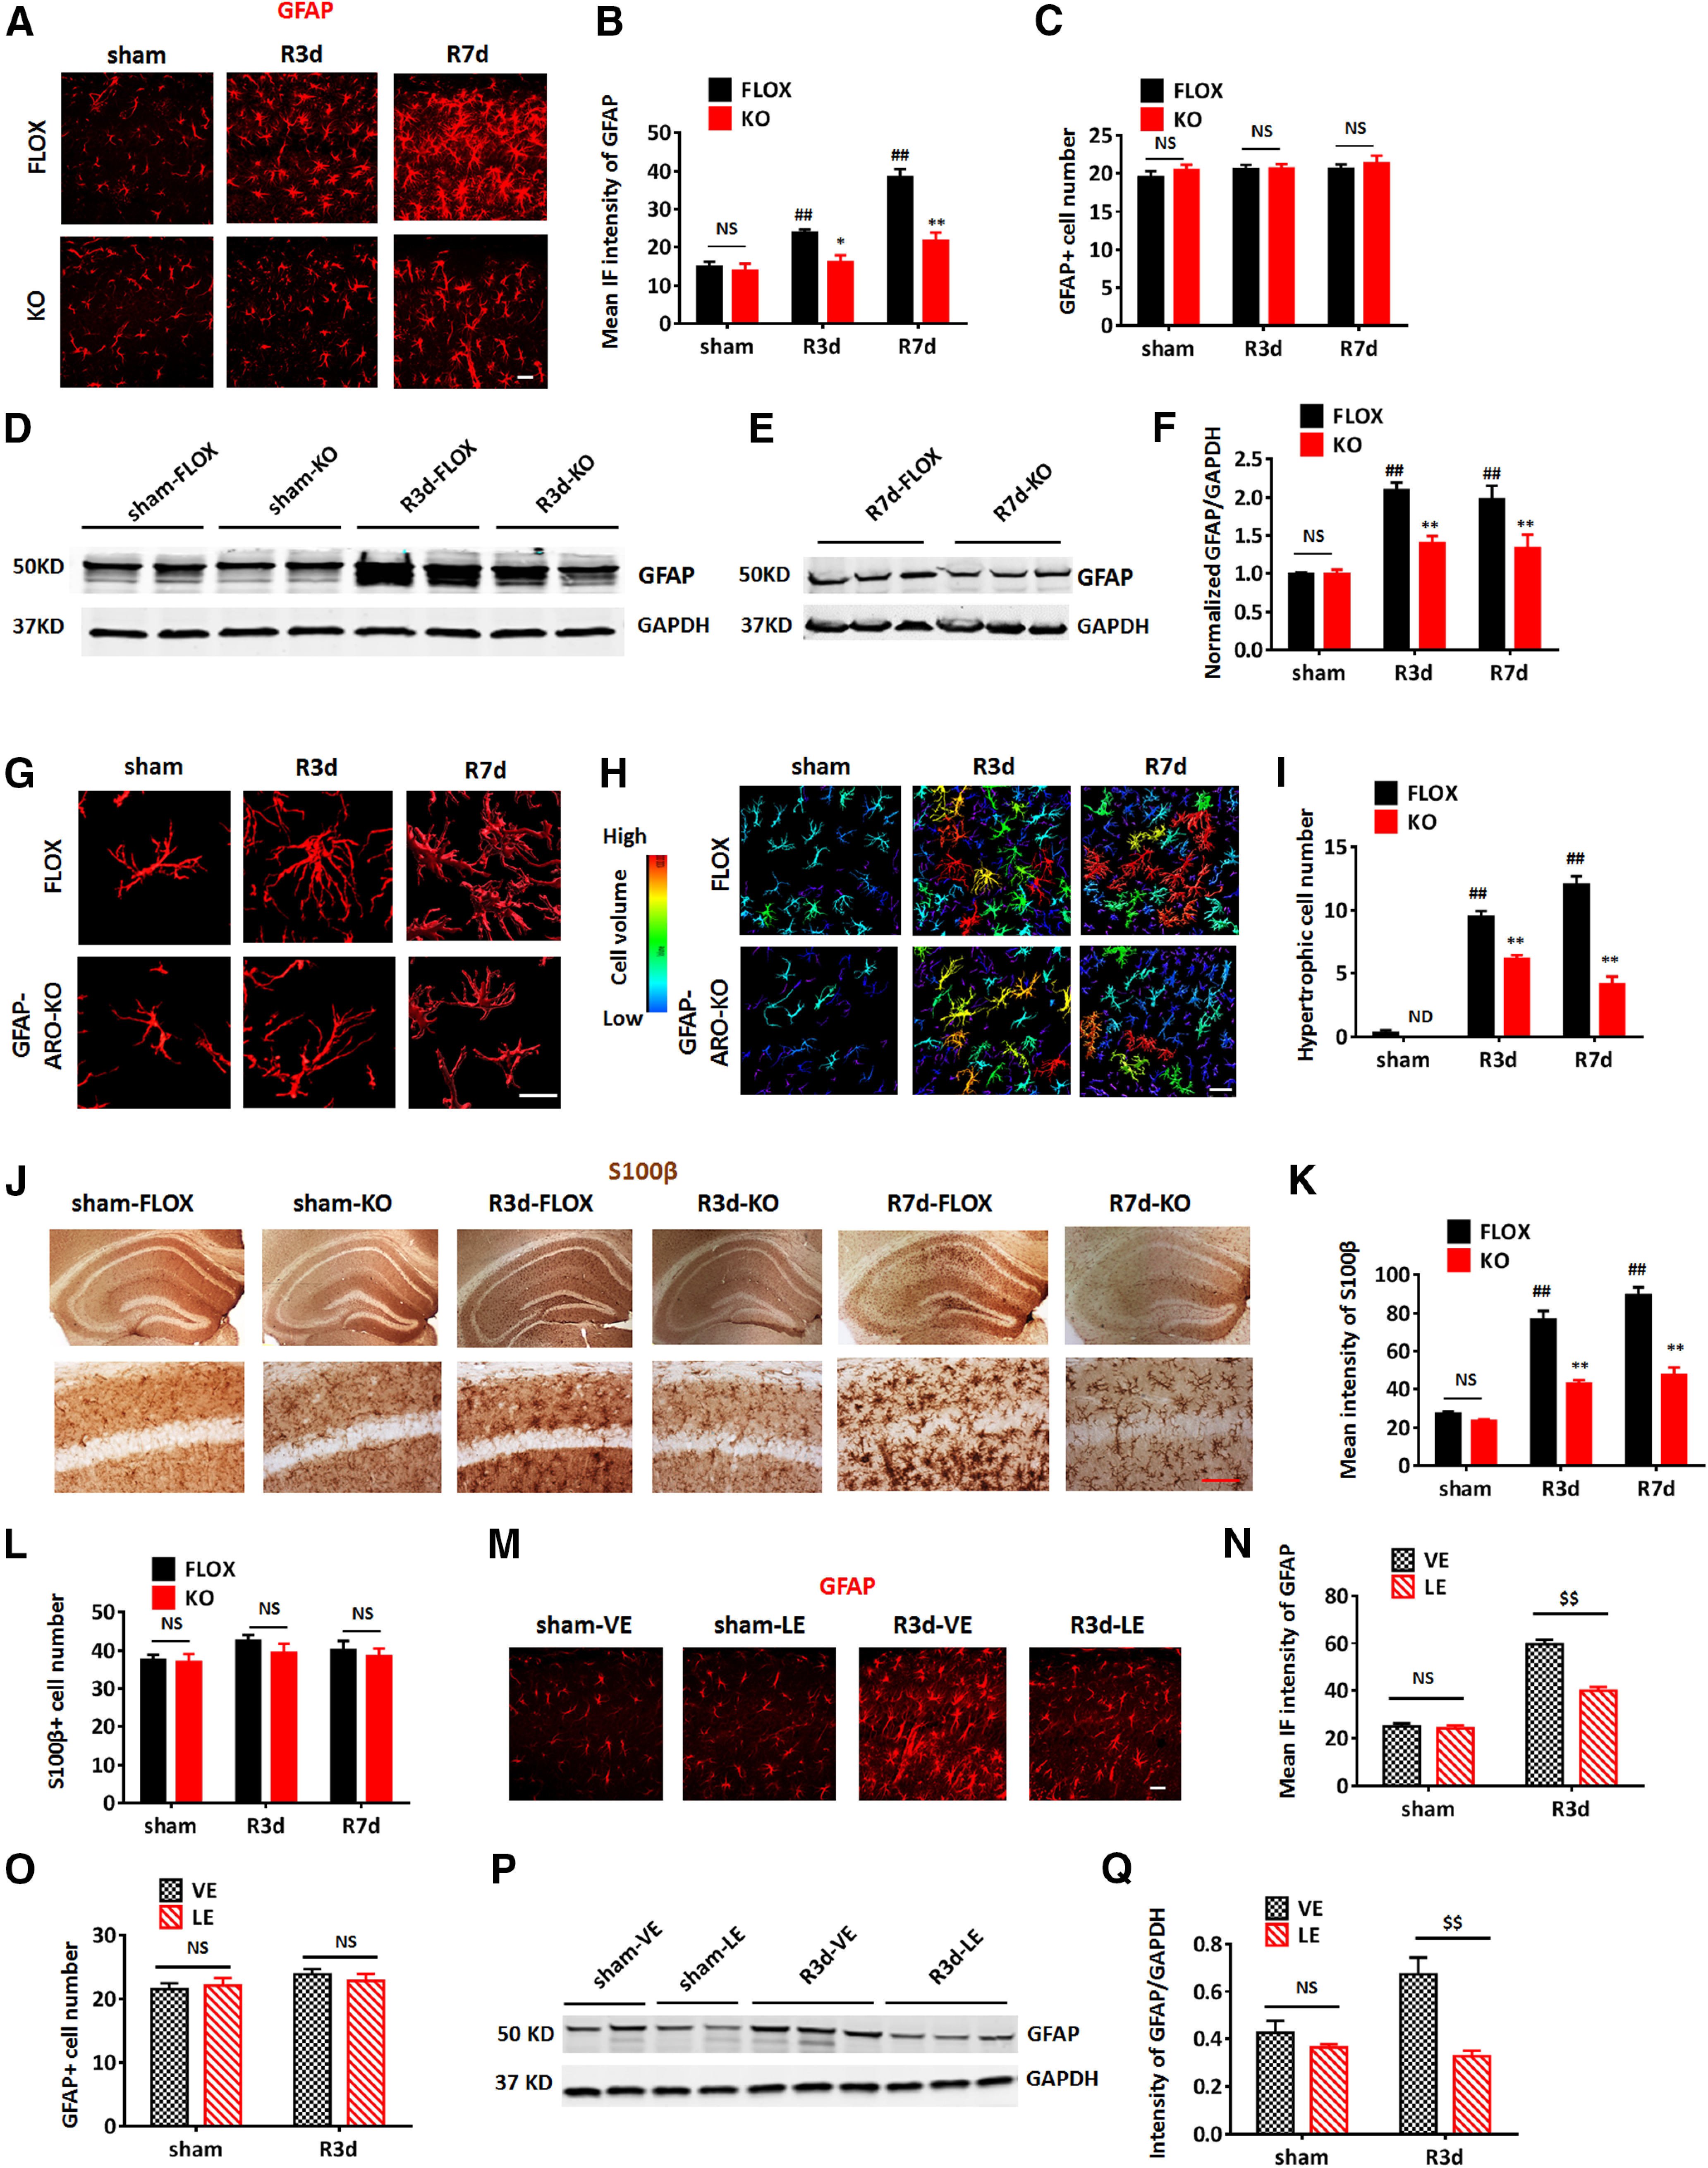
Figure 3.

Depletion of astrocyte-derived E2 in male mice leads to a decrease in reactive astrogliosis after GCI. A–C, Representative images (A) and quantification of mean IF intensity of GFAP (B) and GFAP+ cell number (C) in the hippocampal CA1 region of sham, R3d, and R7d FLOX and GFAP-ARO-KO (KO) mice. Scale bar: 20 μm. D–F, Western blot analysis and quantification of GFAP expression in hippocampal tissue samples collected from male FLOX and KO animals. G–I, Representative 3-D. Reconstructions of single astrocyte (G) and astrocytes in the hippocampal CA1 region (H). Scale bars: 20 μm. I, Cell volume was quantified based on 3-D reconstruction. Cells with volume >750,000 units (yellow, orange, and red cells) were counted as hypertrophic. J–L, Representative images (J) and quantification of mean intensity of S100β (K) and s100β+ cell number (L) in the hippocampal CA1 region. Scale bar: 20 μm. M–O, Representative images (M) and quantification of mean IF intensity of GFAP (N) and GFAP+ cell number (O) in the hippocampal CA1 region of the vehicle (VE)-treated and letrozole (LE)-treated mouse brain. Scale bars: 20 μm. P, Q, Western blot analysis and quantification of GFAP expression in hippocampal tissue samples collected from the male vehicle-treated and letrozole-treated animals. Data are mean ± SEM; n = 6 biologically independent animals; ##p < 0.01 compared with sham, two-way ANOVA followed by post hoc tests; *p < 0.05, **p < 0.01 compared with FLOX, two-way ANOVA; $$p < 0.01 compare to vehicle two-way ANOVA. NS, not significant. ND, not detectable.
