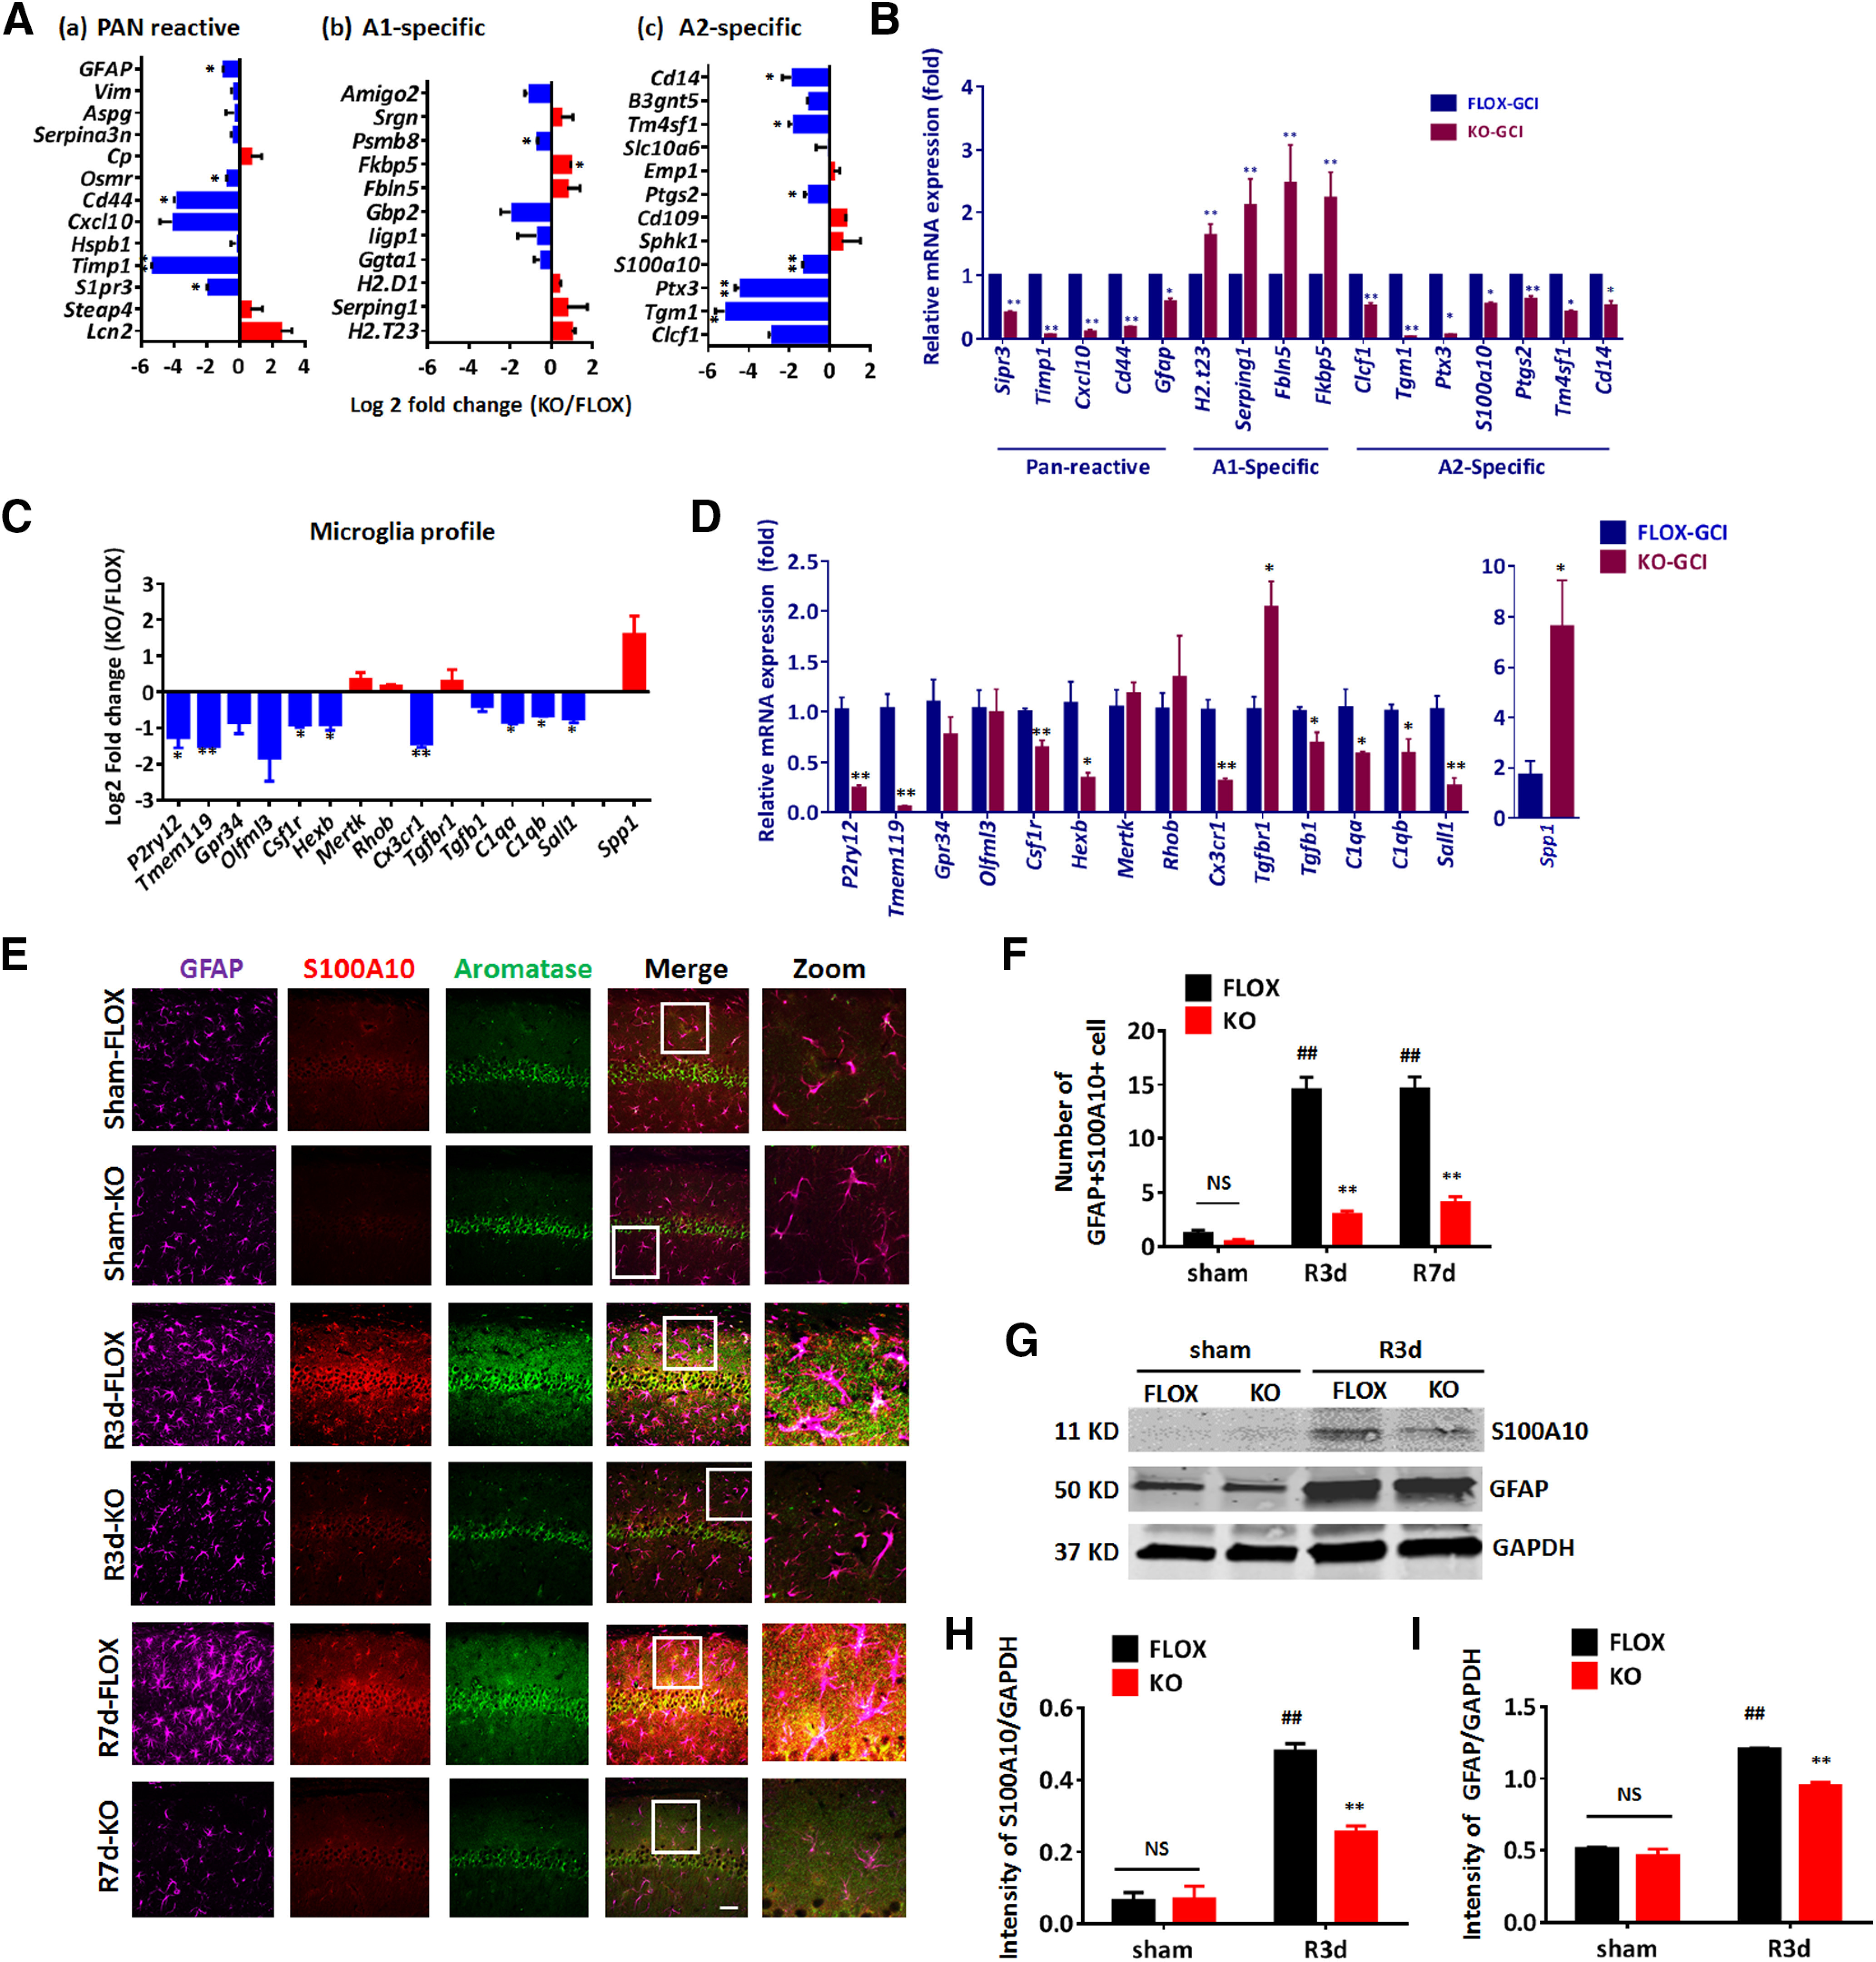
Figure 8.

A2-type reactive astrocytes are decreased in male GFAP-ARO-KO mice after GCI. A, Log2 fold change of PAN/A1/A2 astrocyte genes between the FLOX-GCI-R24h and KO-GCI-R24h samples. B, PAN/A1/A2 astrocyte genes expression profile changes between FLOX-GCI and KO-GCI groups were verified using qRT-PCR (n = 5 biologically independent mice). C, Log2 fold change of microglia-specific signature genes between the FLOX-GCI-R24h and KO-GCI-R24h samples. D, Microglia-specific signature genes changes between FLOX-GCI and KO-GCI groups were verified using qRT-PCR (n = 5 biologically independent mice). E, Representative images of immunostaining for GFAP, S100A10, and aromatase in hippocampal CA1 region. Scale bar: 20 μm. F, Quantification of GFAP-S100A100 double-positive cell number in hippocampal CA1 region. G, Western blot analysis of S100A10 on protein lysates of ACSA2+ astrocytes isolated from the hemispheres of sham and R3d mice. H, I, Densitometry analysis of Western blot analysis results by ImageJ. Intensities of the S100A10 (H) and GFAP (I) band were normalized to the intensity of GAPDH from two independent experiments. Samples from three mice were pooled for one collection for each experiment. Data are mean ± SEM; #p < 0.05, ##p < 0.01 versus sham, two-way ANOVA followed by post hoc; *p < 0.05, **p < 0.01 versus KO with FLOX, (A–D) multiple t test; (F–I) two-way ANOVA followed by post hoc. NS, not significant.
