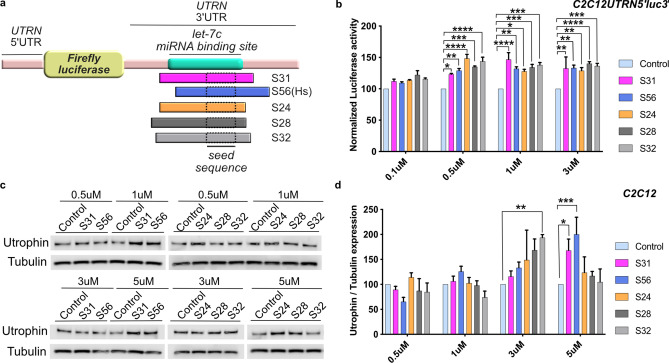
Figure 2.
Let-7c PMO SBO upregulates utrophin expression in the C2C12 cell line. (a) Schematic diagram showing the relative position of the let-7c binding site (green) of five different let-7c PMO SBOs in UTRN 3′UTR. (b) Luciferase expression in C2C12UTRN5′luc3′ reporter cell line after treatment with 0.1 µM, 0.5 µM, 1 µM and 3 µM of control or five different let-7c PMO SBOs for 24 hrs. Data shown as percentage of normalized luciferase expression compared with control PMO treated cells (n = 3). (c) Endogenous utrophin expression in C2C12 cell line after treatment with 0.5 µM, 1 µM, 3 µM and 5 µM of control or five different let-7c PMO SBOs for 48 hrs. (d) Quantification of endogenous utrophin expression in C2C12 cell line shown as percentage of normalized utrophin expression compared with control PMO treated cells (n = 3). Each bar represents mean ± SEM. Statistical analysis performed by Two-way ANOVA Tukey’s multiple comparisons test *p < 0.1, **p < 0.01, ***p < 0.001, ****p < 0.0001.

