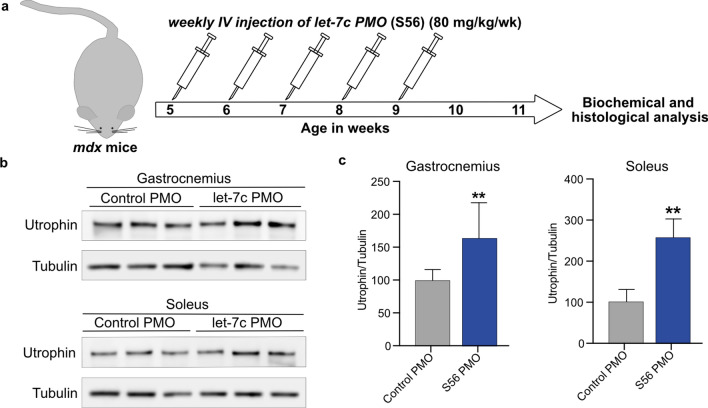
Figure 3.
Higher expression of utrophin in mdx mice after five weeks of treatment with 80 mg/kg/wk S56 PMO. (a) Diagram of the experimental pipeline adopted for the study. (b) Western blot showed higher level of utrophin expression in gastrocnemius and soleus muscles of S56 PMO treated mdx mice. Samples from three different mdx mice treated with control or S56 PMO were shown. (c) Quantification of normalized utrophin level in control and S56 PMO treated mdx mice gastrocnemius and soleus muscle (n = 6 mice for both groups). Data shown as percentage of normalized utrophin level compared to control PMO treated mdx mice. Each bar represents mean ± SEM. Statistical analysis performed by Mann–Whitney nonparametric test, **p < 0.01.

