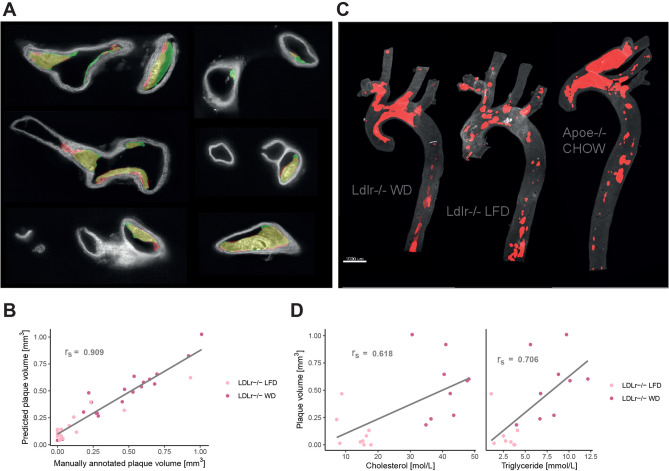
Figure 1.
Plaque identification based on tissue autofluorescence. (A) Images of the aorta with annotated plaques shown in green and plaque predicted by the deep learning model in red (overlap in yellow). All images are part of the test set and derived from two aortas of Apoe−/− mice on western diet. (B) Spearman correlation (rs = 0.909, p value < 2.2e−16) between manually annotated plaque volume and plaque volume predicted by the deep learning model. Regression lines added for visualization purposes. (C) Plaque predictions by the model in 3D reconstructed aortas. (D) Spearman correlation of plaque volume with plasma cholesterol (rs = 0.618, p value = 0.007) and triglyceride (rs = 0.706, p value = 0.002). Regression lines are added for visualization purposes.

