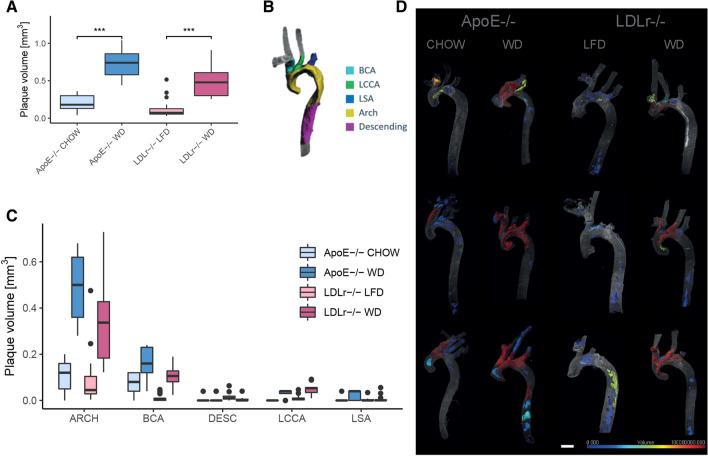
Figure 2.
Plaque burden throughout the aorta and branching vessels. (A) Total plaque volume in ApoE−/− and LDLr−/− mice on different diets. Plaque volume is significantly increased in mice on western diet (Man-Whitney test, ApoE−/− p value = 0.0002, LDLr−/− p value = 1.15e-7). (B) Division of the aorta into 5 anatomical structures. (C) Plaque volume per anatomical structure. (D) Visualization of the sizes of individual plaque objects (scale bar 1000 μm).

