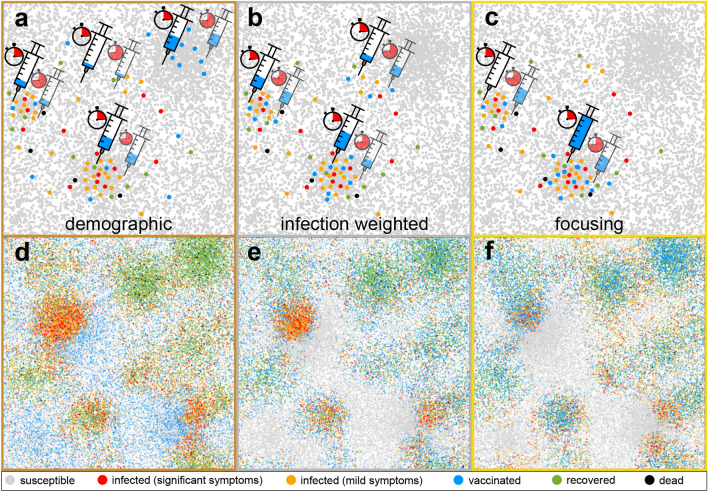
Figure 1.
Schematic illustration of the proposed spatiotemporal vaccine distribution strategies and of the simulation model. (a) shows the standard “demographic strategy”, where vaccines (dosage needles) are continuously distributed among all regions (e.g. cities) proportionally to their population density (dots represent groups of individuals). (b) shows the “infection weighted” strategy, where vaccines are distributed proportionally to the local bi-linear incidence rates (red and orange dots) and (c) shows the “focusing strategy” where at early times (clocks; transparent syringes show the vaccine distribution at later times) only the region with the largest bi-linear incidence rate receives vaccines, until the rate of a second region catches up and also receives vaccines. (d)–(f) show typical simulation snapshots for an inhomogeneously distributed population with a “city size distribution” following Zipf’s law, taken 56 days after the onset of vaccination when following the demographic strategy, the infection weighted strategy or the focusing strategy, respectively. The legend below shows the states in our model.

