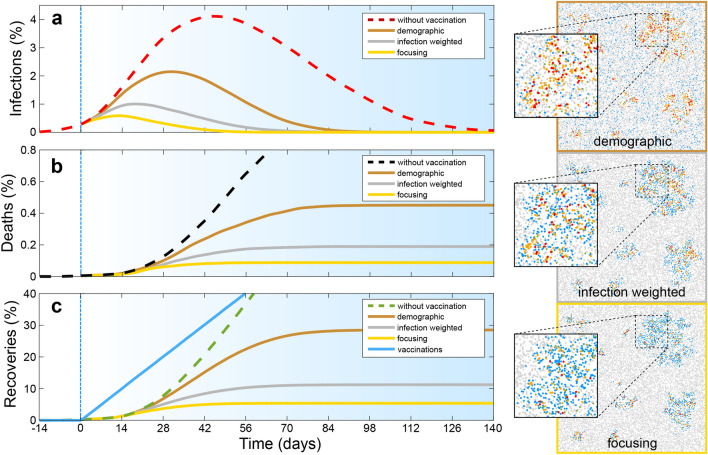
Figure 2.
Competition of spatiotemporal vaccine distribution strategies regarding the time evolution of the fraction of infected individuals (a), the fraction of deaths (b), and of recoveries and vaccinations (c). Dashed red lines show simulation results without vaccination and bronze, silver (or grey) and gold show results for the demographic vaccine distribution strategy, the infection weighted strategy and the focusing strategy respectively. The blue line in panel (c) shows the vaccinated fraction of the population and vertical blue lines mark the onset of vaccination; the specific time of which is unimportant (see text). Panels on the right show simulation snapshots taken 14 days after the onset of vaccine production; insets magnify extracts of these snapshots. Parameters: Disease duration ; latency time , survival probability , total vaccination rate and initial reproduction number . (The latter is based on , , ; see “Methods”); ; curves are averaged over 100 random initial ensembles with .

