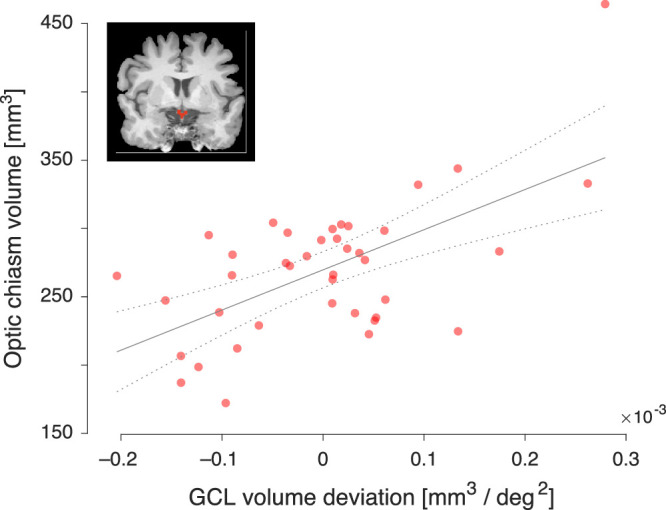
Figure 7.

Relation of modeled GCL tissue volume to optic chiasm volume. Optic chiasm volume was measured from an anatomic MRI image in each of forty participants (example coronal MRI image inset; optic chiasm indicated in red). The optic chiasm volume (y-axis) for each participant was related to individual variation in measured GCL tissue volume (x-axis). Variation in GCL tissue volume was modeled as the weighted and combined influence of measured mean GCL tissue volume, with and without adjustment for the effects of variation in axial length. The best fit line (with 95% confidence intervals) of the model is shown.
