
Figure 12.
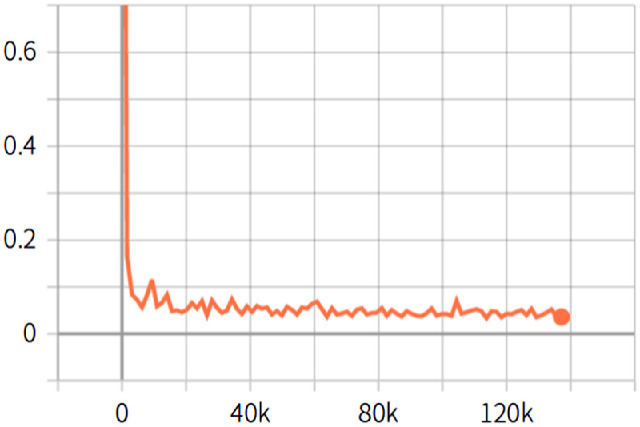
Loss convergence graph. The abscissa indicates the number of iterations, the ordinate indicates the loss value, and the orange curve indicates the entire convergence process of the training.
Official websites use .gov
A
.gov website belongs to an official
government organization in the United States.
Secure .gov websites use HTTPS
A lock (
) or https:// means you've safely
connected to the .gov website. Share sensitive
information only on official, secure websites.
Loss convergence graph. The abscissa indicates the number of iterations, the ordinate indicates the loss value, and the orange curve indicates the entire convergence process of the training.