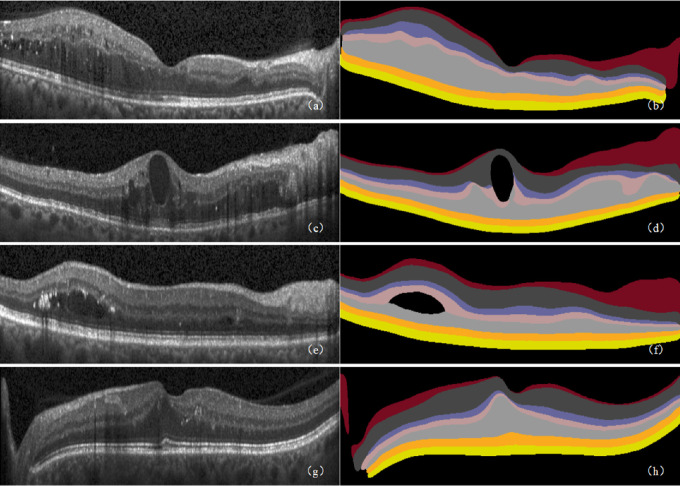
Figure 9.
Retinal seven-layer segmentation prediction results on the Duke data set. (a, c, e, g) Original images. (b, d, f, h) Corresponding segmentation results. In the segmentation result graph, the pixel values of the different retinal layers are different, thereby showing the seven layers of the retinal interlayer structure.

