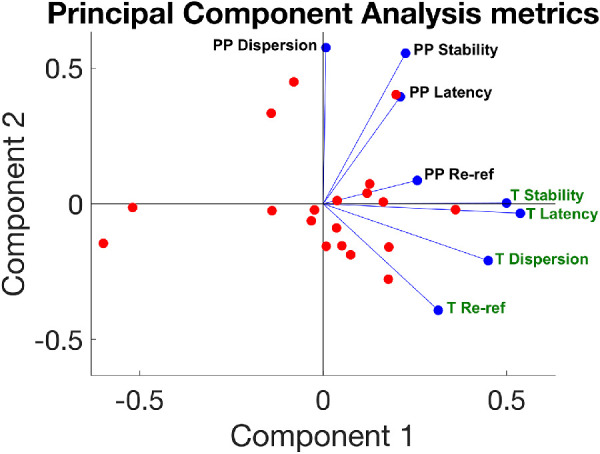
Figure 6.

Principal component analysis. The graph shows the distributions along the two main components; individual participants’ scores on these components are plotted as red dots. The weighting of each of the metrics is shown in blue. Change scores for each of the four metrics are calculated for the training task data (labeled “T” and green), as well as for the data during the pre/post tests of transfer (labeled “PP” and black). These metrics are training saccadic re-referencing, training first saccade landing dispersion, training latency of target acquisition, training fixation stability, pre/post saccadic re-referencing, pre/post first saccade landing dispersion, pre/post latency of target acquisition, and pre/post fixation stability.
