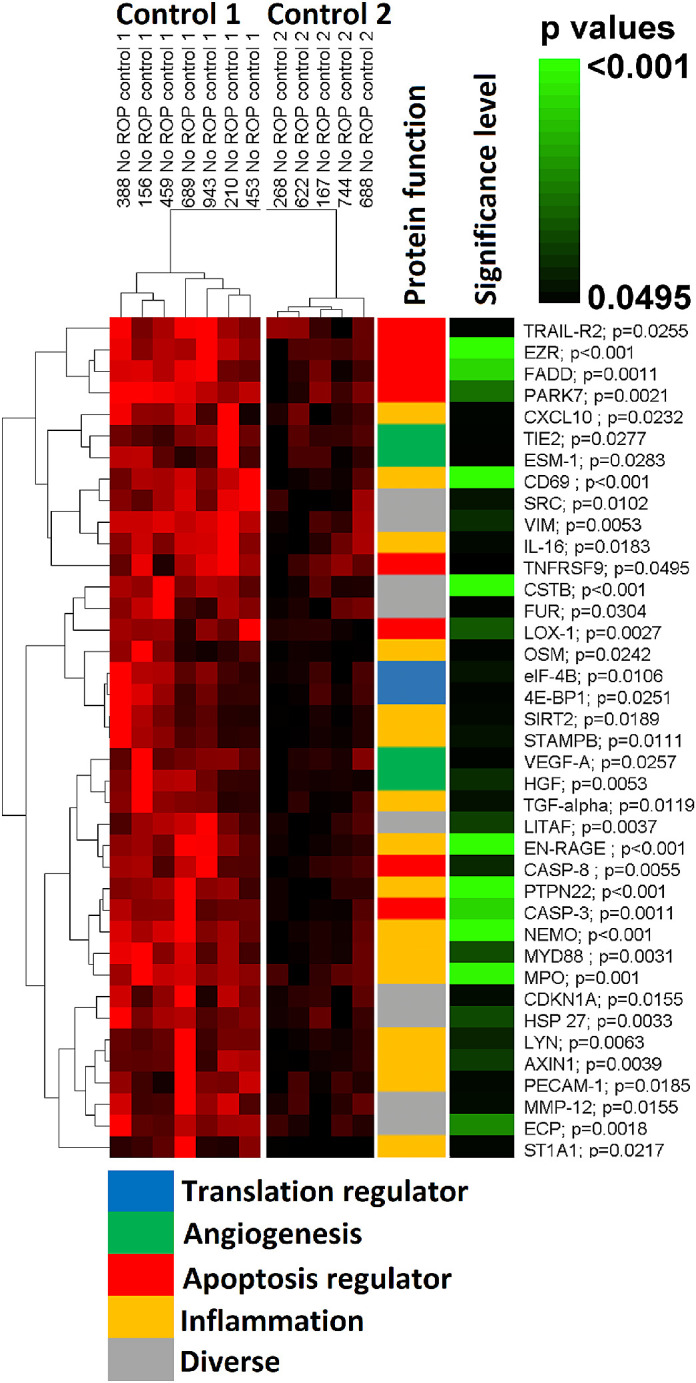
Figure 2.

Clustering of infants without ROP (controls 1 and 2) according to biomarker expression (n = 39). Two control groups could be defined by clustering. Thirty-nine of 202 biochemical markers showed significant differences between the two control groups (controls 1 and 2). Higher intensity in red corresponds to higher value of a certain biochemical marker expression level. The function of the proteins and the significance level of differences between the two controls are labeled with colors. Higher intensity in green corresponds to higher level of significance; P values are shown next to each biochemical marker.
