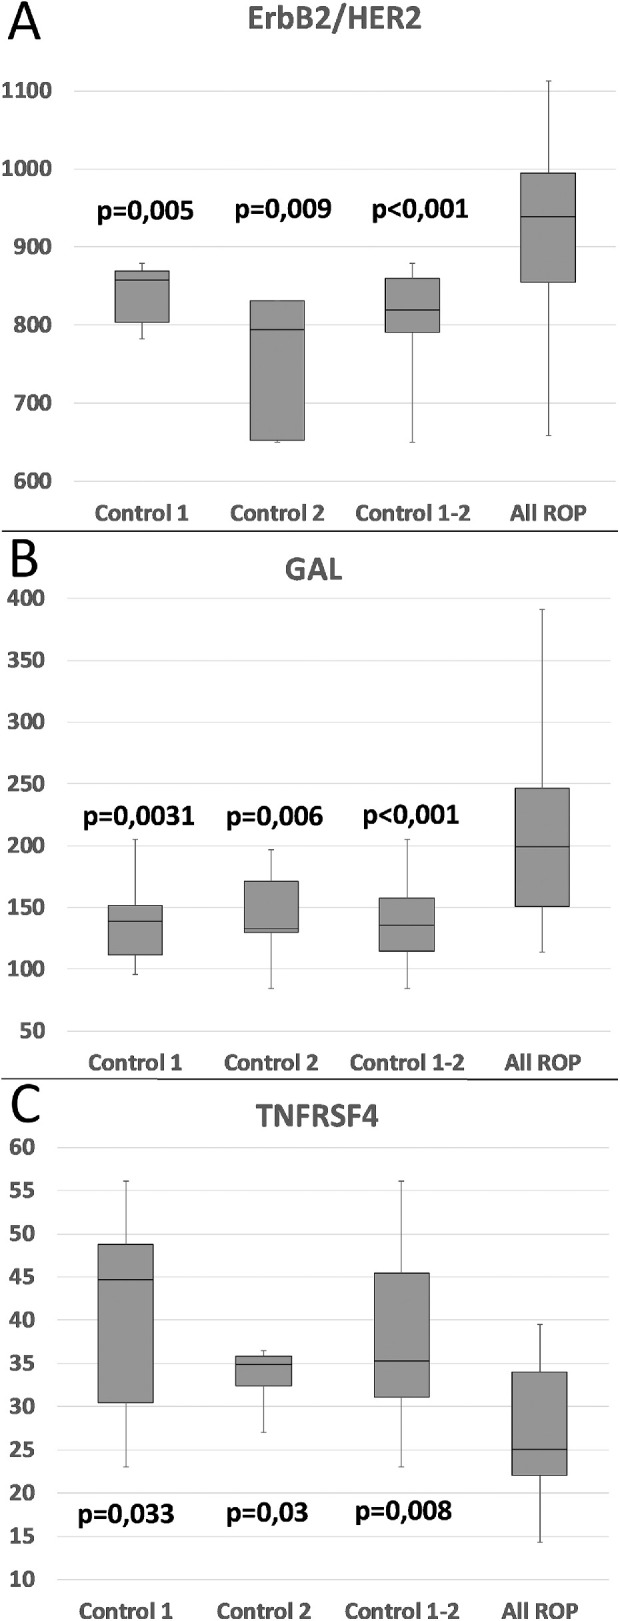
Figure 6.

Biochemical markers (ErbB2/HER2, GAL, TNFRSF4) in group 6. All three biochemical markers from group 6 show significant differences between all combinations of controls (control 1, control 2, and all controls) and all patients with ROP. P values correspond to significant differences between controls and all patients with ROP. Note that ErbB2/HER2 and GAL are higher in controls, whereas TNFRSF4 is lower than in ROP.
