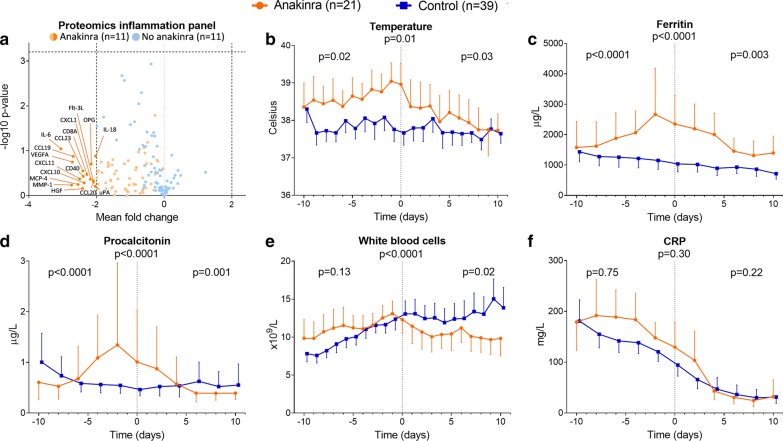
Fig. 2.
Proteomics inflammation panel and kinetics of inflammatory parameters. a Volcano plot of proteomics inflammation panel for 75 proteins in both groups. Mean fold change and − 10log(p value) were shown on the x-axis and y-axis, respectively. p values were calculated using t tests. A mean fold change of ≤ -2 or ≥ 2 was considered relevant. A − 10log(p value) > 3.204 was considered significant (p < 0.000625). b Body temperature and plasma levels of c ferritin, d procalcitonin, e white blood cell counts, and f C-reactive protein (CRP) over time within 10 days pre- and post-start anakinra alignment day (day 0). Data are presented as geometric mean with 95% confidence intervals and were analyzed using mixed-models analysis (time*group interaction factor) to evaluate differences between groups over time. p values under graph titles reflect overall between-group differences (day − 10 until day 10). Between-group p values for day − 10 until day 0 and day 0 until day 10 are shown on the left and right of each panel, respectively

