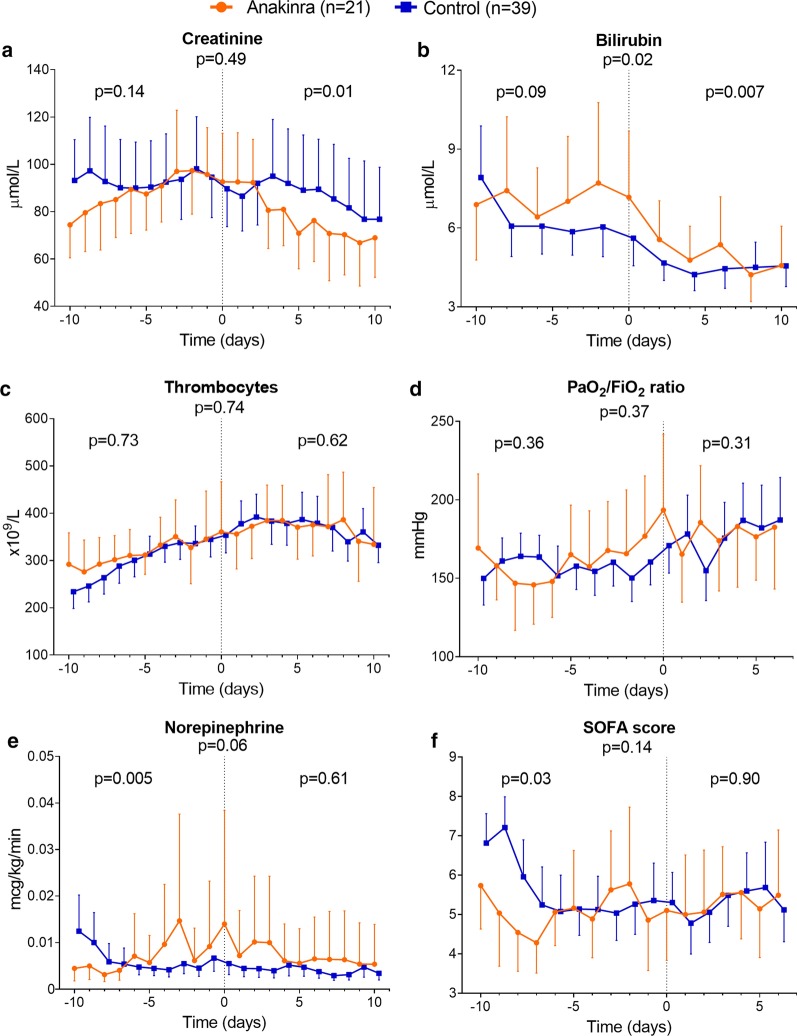
Fig. 3.
Individual parameters of sequential organ failure assessment (SOFA) score and total SOFA score. Plasma levels of a creatinine, b bilirubin, and c thrombocytes and d PaO2/FiO2 (P/F) ratio, e infusion rate of norepinephrine, and f SOFA score over time within 10 days pre- and post-alignment day (day 0). PaO2/FiO2 ratio and SOFA score were presented until day 6. Data are presented as geometric mean with 95% confidence intervals and were analyzed using mixed-models analysis (time*group interaction factor) to evaluate differences between groups over time. p values under graph titles reflect overall between-group differences (day − 10 until day 6 or 10). Between-group p values for day − 10 until day 0 and day 0 until day 6 or 10 are shown on the left and right of each panel, respectively

