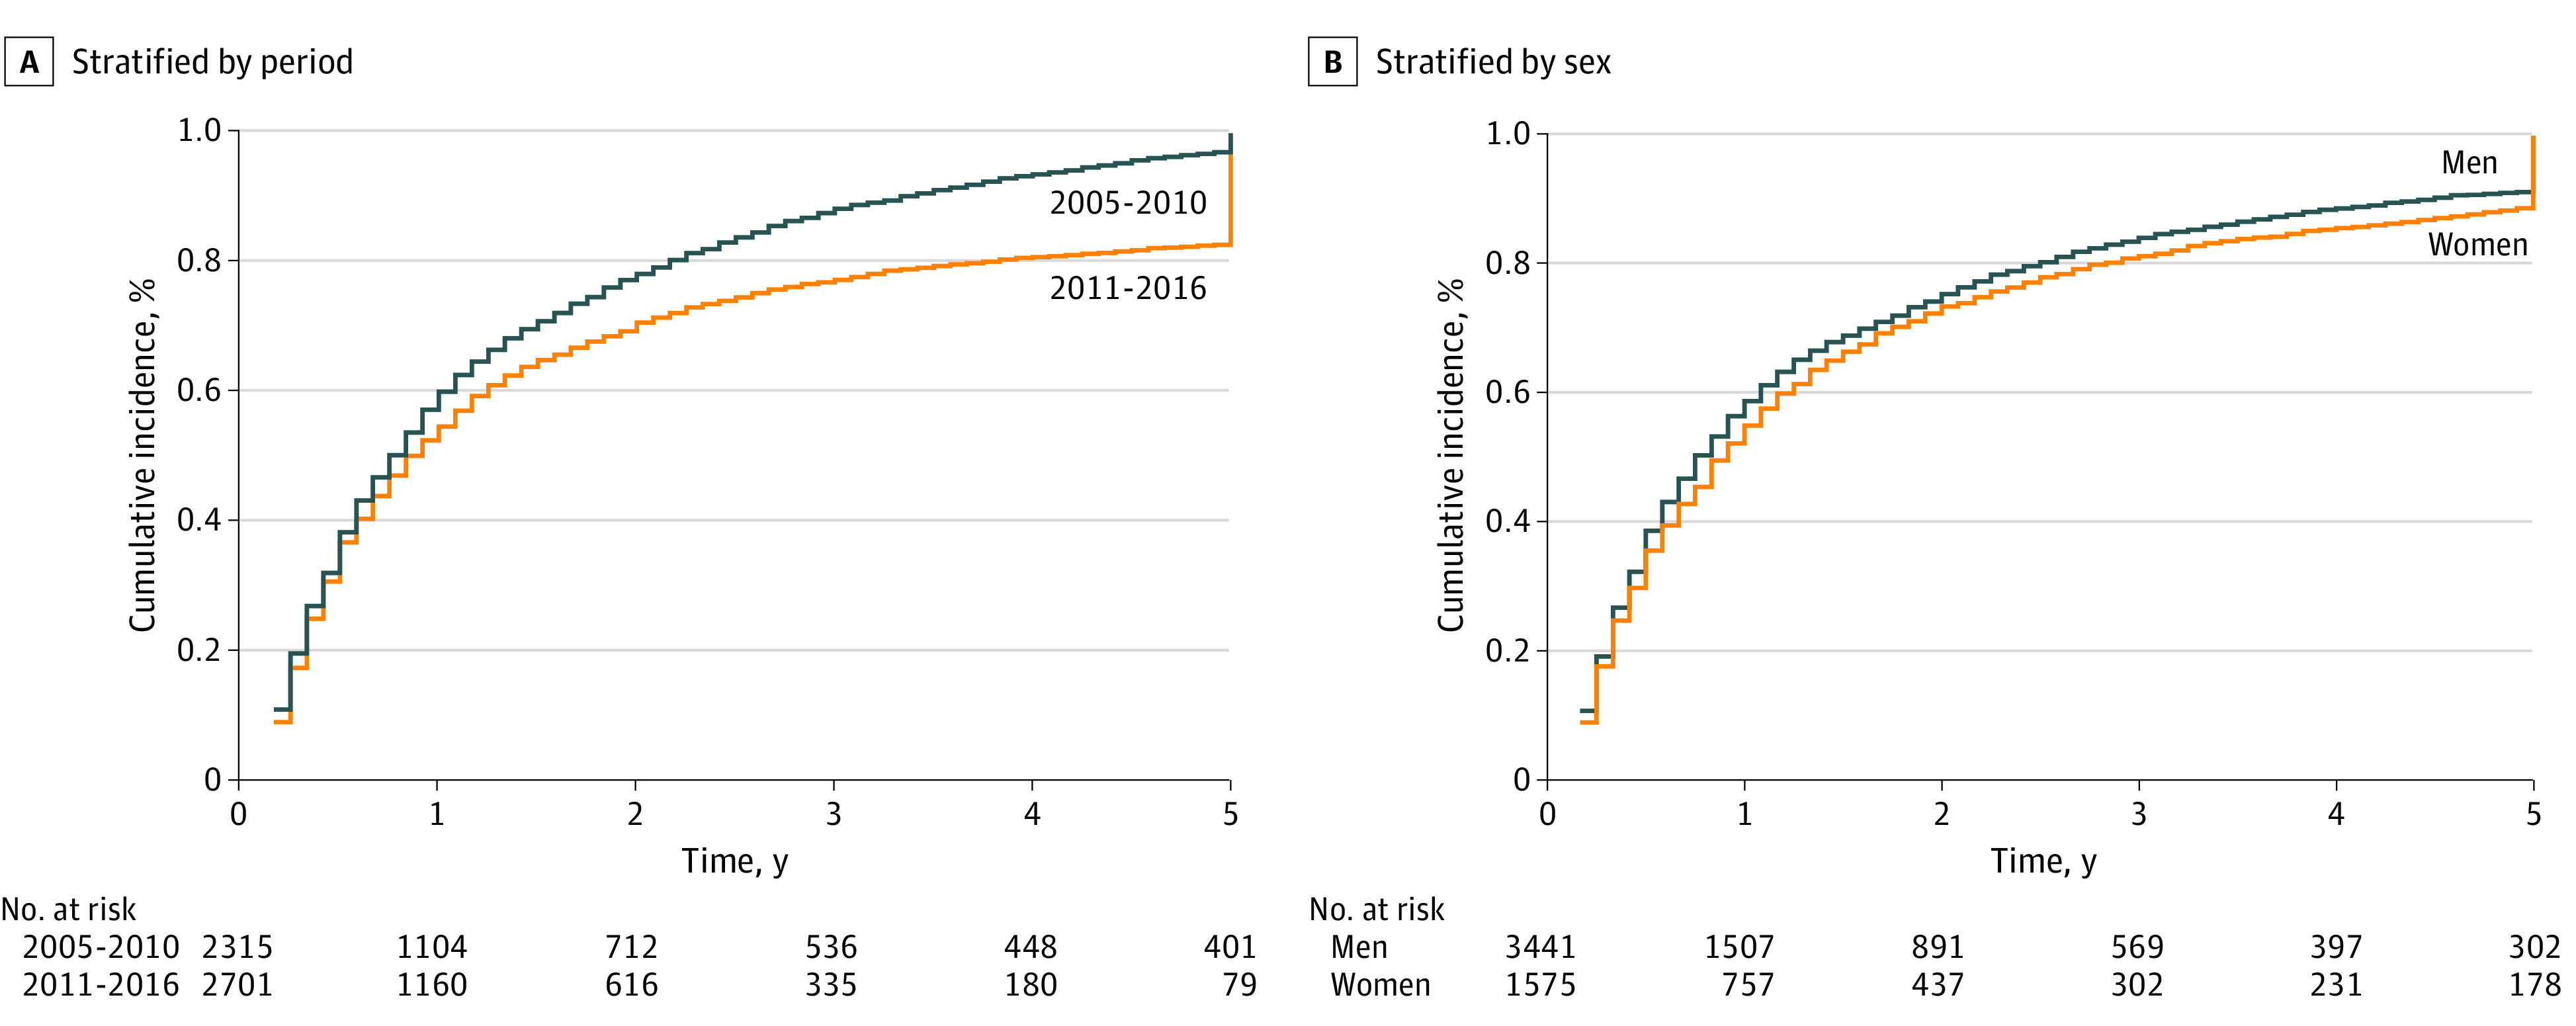
Figure 1. Five-Year Cumulative Incidence Function of All-Cause Mortality.

A, Stratified by 2005-2010 and 2011-2016 time periods. B, Stratified by sex. Years of observation were compiled from the date of first primary melanoma diagnosis to the date of death or last follow-up.
