Figure 1.

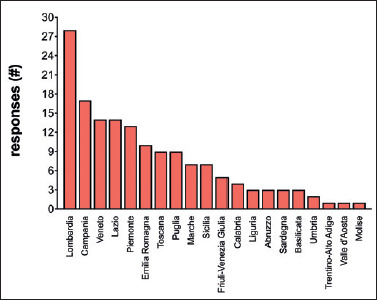
Representation of the response rate to our questionnaire sorted by region. The total number of responses is reported on the abscissa axis, while the ordinate axis indicates the 20 Italian regions.

Representation of the response rate to our questionnaire sorted by region. The total number of responses is reported on the abscissa axis, while the ordinate axis indicates the 20 Italian regions.