-
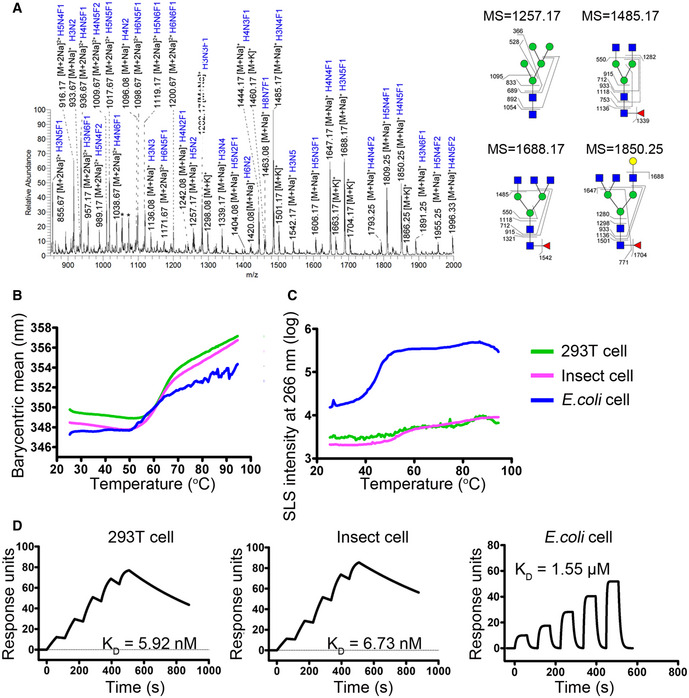
A
N‐glycan composition of PD‐1 protein expressed from 293T cells by ESI‐MS analysis. N‐glycans of representative peaks from ESI‐MS were identified by MS/MS analysis. H, mannose; N, N‐acetylglucosamine; F, fucose. Structural formulas: blue square, N‐acetylglucosamine; red triangle, fucose; green circle, mannose; yellow circle, galactose.
-
B, C
Accelerated thermal stability of PD‐1 proteins obtained from 293T cells (green line), insect cells (pink line), or E. coli (blue line) is characterized in all‐in-one UNcle platform. Protein unfolding is observed as an increase in barycentric mean (B) while small particle formation of the samples is observed as an increase in SLS intensity at 266 nm (C).
-
D
SPR analysis of the binding characteristics of camrelizumab with PD‐1 expressed in 293T cells, insect cells or E. coli cell, which enabled different levels of glycosylations. The binding affinity is presented as K
D. The datum presented here is a representative of two independent experiments with similar results.

