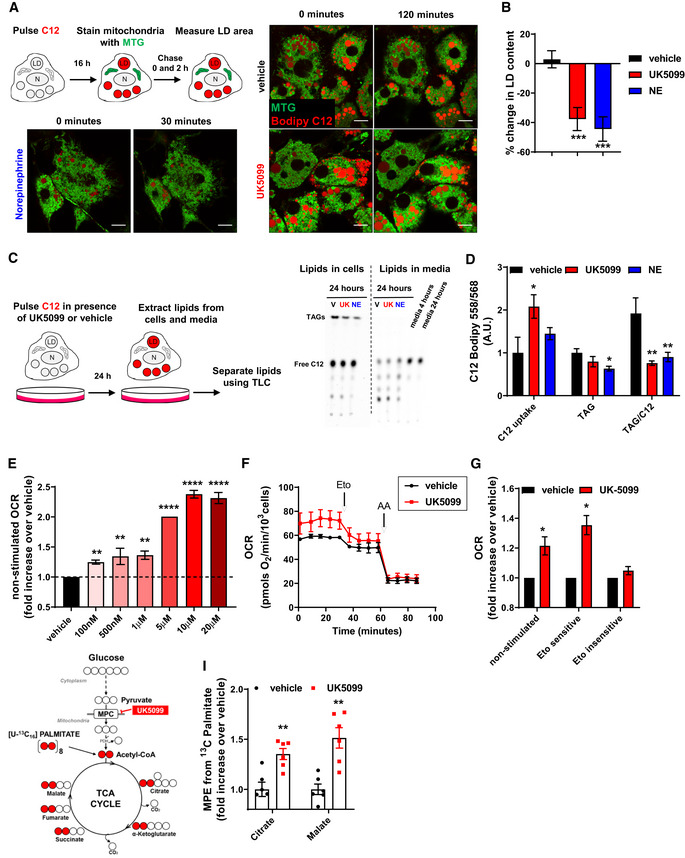
Figure 1. Inhibition of the mitochondrial pyruvate carrier increases energy expenditure fueled by fatty acid oxidation.

-
A, BEffect of MPC inhibition on cellular lipid droplet content. (A) Live‐cell super‐resolution confocal imaging of primary brown adipocytes pre‐stained overnight with the fatty acid tracer BODIPY C12 558/568 (Bodipy C12, red). Cells were stained with mitotracker green (MTG, green) prior to imaging. Cells were imaged before and 120 min after treatment with either vehicle (DMSO) or 100 nM UK5099. As a positive control, cells were imaged 30 min after treatment with 1 µM norepinephrine. LD, lipid droplet; N, nucleus. Scale bar = 10 µm. (B) Quantification of changes in lipid droplet cross‐sectional area with indicated treatments from images shown in (A). Data are represented as percentage change in LD area at time = 120 min compared to time = 0 min. Data represent n = 23–34 cells from 3 individual experiments. ***P < 0.0001 by ANOVA, relative to vehicle.
-
C, DEffect of MPC inhibition on fatty acid uptake and incorporation into triacylglycerides (TAGs). (C) Representative thin‐layer chromatography (TLC) plate of lipids extracted from primary brown adipocytes and cell culture media. Cells were incubated with Bodipy C12 in presence of vehicle (V), 100 nM UK5099 (UK) or 1 µM norepinephrine (NE) for 24 h and triacylglyceride (TAG) synthesis (Lipids in cells) and fatty acid uptake (Lipids in media) were detected. The relative polarity of the lipid species determines the motility, with nonpolar TAG migrating the furthest. (D) Quantification of C12 uptake from media, TAG in cells and TAG per amount of free fatty acid uptake shown in (C), n = 5 individual experiments. Note that UK5099 treatment decreases the amount of synthesized TAG per free fatty acid uptake, similarly to NE. *P < 0.05, **P < 0.01 by ANOVA, relative to vehicle.
-
E–GEffect of UK5099 treatment on cellular energy expenditure. Fully differentiated primary brown adipocytes were pre‐treated with vehicle (DMSO) or UK5099 at indicated concentrations for 2 h. Oxygen consumption rates (OCR) were measured in respirometry media supplemented with 5 mM glucose and 3 mM glutamine in the presence of vehicle or UK‐5099. (E) Quantification of non‐stimulated OCR from n = 3–7 individual experiments. Data were normalized to vehicle for each individual experiment. Note that UK5099 increases OCR in non‐stimulated brown adipocytes. **P < 0.01, ****P < 0.0001 by ANOVA, relative to vehicle. (F) Brown adipocytes were treated with 100 nM UK5099 or vehicle. Etomoxir (Eto; 40 µM) and antimycin A (AA; 4 µM) were injected where indicated. Representative OCR traces averaging 6 technical replicates. (G) Quantification of non‐stimulated OCR, etomoxir‐sensitive, and etomoxir‐insensitive OCR from n = 4 individual experiments. Data were normalized to vehicle for each individual experiment. *P < 0.05 compared to vehicle by Student’s t‐test.
-
H, IEffect of MPC inhibition on adipocyte fuel preference toward fatty acid. (H) Schematic representation of metabolite tracing using [U‐13C16] palmitate. (I) [U‐13C16] palmitate tracing in fully differentiated primary brown adipocytes treated with 5 µM UK5099 or vehicle for 24 h. Data show mole percent enrichment (MPE) of isotope‐labeled substrate into respective metabolite. Data were normalized to vehicle for each individual replicate. n = 6 technical replicates from 2 individual experiments. **P < 0.01 compared to vehicle by Student’s t‐test.
Data information: All data are presented as mean ± SEM.
