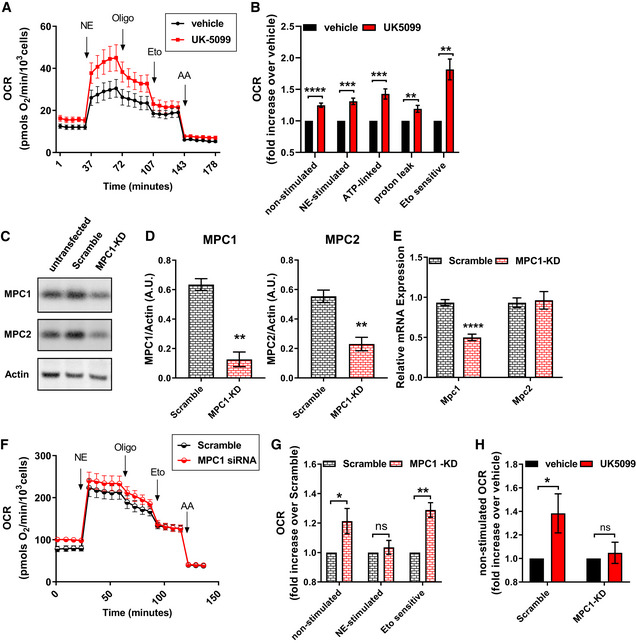
Figure 2. MPC1 inhibition stimulates mitochondrial respiration coupled to ATP synthesis in brown adipocytes.

-
A, BEffect of UK5099 treatment on norepinephrine‐stimulated energy expenditure. Fully differentiated primary brown adipocytes were pre‐treated with vehicle (DMSO) or 100 nM UK5099 for 2 h. OCR were measured in respirometry media supplemented with 5 mM glucose and 3 mM glutamine in the presence of vehicle or UK5099. Norepinephrine (NE; 1 µM), oligomycin A (Oligo; 4 µM), etomoxir (Eto; 40 µM), and antimycin A (AA; 4 µM) were injected where indicated. (A) Representative OCR traces averaging 4 technical replicates. (B) Quantification of non‐stimulated OCR, NE‐stimulated OCR, ATP‐linked OCR, mitochondrial proton leak and Eto‐sensitive OCR as shown in (A) from n = 9 individual experiments. The effects of UK5099 treatment were normalized to vehicle for each experiment. **P < 0.01, ***P < 0.001, ****P < 0.0001 compared to vehicle by Student’s t‐test.
-
C–HPrimary brown adipocytes were transfected with MPC1 siRNA (MPC1 KD) or Scramble RNA (Scramble). (C) Representative Western blot analysis of MPC1, MPC2, and actin. (D) Quantification of MPC1 and MPC2 expression normalized to actin from Western blots in (C) from n = 3 individual experiments. **P < 0.01 compared to Scramble by Student’s t‐test. (E) mRNA levels of MPC1 and MPC2 from n = 3 individual experiments. ****P < 0.0001 compared to Scramble by Student’s t‐test. (F) Representative OCR traces of differentiated primary brown adipocytes averaging 6 technical replicates. OCR were measured in respirometry media supplemented with 5 mM glucose and 3 mM glutamine. Norepinephrine (NE; 1 µM), oligomycin A (Oligo; 4 µM), etomoxir (Eto; 40 µM), and antimycin A (AA; 4 µM) were injected where indicated. (G) Quantification of basal, NE‐stimulated and Eto‐sensitive OCR as shown in (F) from n = 7 individual experiments. Data were normalized to Scramble RNA for each individual experiment. ns P > 0.05, *P < 0.05, **P < 0.01 compared to Scramble by Student’s t‐test. (H) Quantification of basal OCR in response to 100 nM UK5099 treatment in Scramble RNA of MPC1 siRNA‐transfected cells from n = 5 individual experiments. Data were normalized to vehicle for each experiment. Note that UK5099 capacity to increase OCR in non‐stimulated brown adipocytes is absent in cells where MPC1 is downregulated. ns P > 0.05, *P < 0.05 compared to vehicle by Student’s t‐test.
Data information: All data are presented as mean ± SEM.
