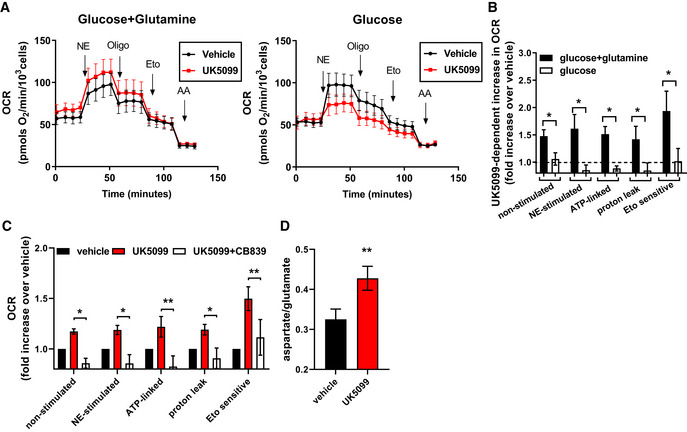
Figure 3. Glutamine metabolism is required for increased energy expenditure induced by MPC inhibition.

-
A, BRequirement for glutamine in UK5099‐induced energy expenditure. Primary brown adipocytes were pre‐treated with vehicle (DMSO) or 100 nM UK5099 for 2 h. OCR were measured in presence of either 5 mM glucose and 3 mM glutamine or 5 mM glucose alone. Norepinephrine (NE; 1 µM), oligomycin A (Oligo; 4 µM), etomoxir (Eto; 40 µM), and antimycin A (AA; 4 µM) were injected where indicated. (A) Representative OCR traces averaging 6 technical replicates. (B) Quantification of non‐stimulated OCR, NE‐stimulated OCR, ATP‐linked OCR, mitochondrial proton leak and etomoxir‐sensitive OCR after vehicle or UK5099 treatment as shown in (A) from n = 4 individual experiments. Data were normalized to vehicle for each experiment. Note that UK5099 treatment increased OCR only when cells were assayed in the presence of both glucose and glutamine. *P < 0.05, compared to vehicle by Student’s t‐test.
-
CEffect of glutaminase inhibitor on UK5099‐induced energy expenditure. Primary brown adipocytes were pre‐treated with either vehicle (DMSO), 100 nM UK5099, or 100 nM UK5099 + 2.5 µM CB839 for 2 h. OCR were measured in respirometry media supplemented with 5 mM glucose and 3 mM glutamine in the presence of vehicle, UK5099 or UK5099 + CB839 from n = 5 individual experiments. Data were normalized to vehicle for each experiment. *P < 0.05, **P < 0.01 by ANOVA.
-
DEffect of MPC inhibition on glutamate/aspartate ratio measurement. Glutamate/aspartate ratio was quantified using GC‐MS as a measure of glutamine catabolism. Primary brown adipocytes were treated for 24 h with vehicle (DMSO) or 10 µM UK5099 from n = 6 individual experiments. **P < 0.01, compared to vehicle by Student’s t‐test.
Data information: All data are presented as mean ± SEM.
