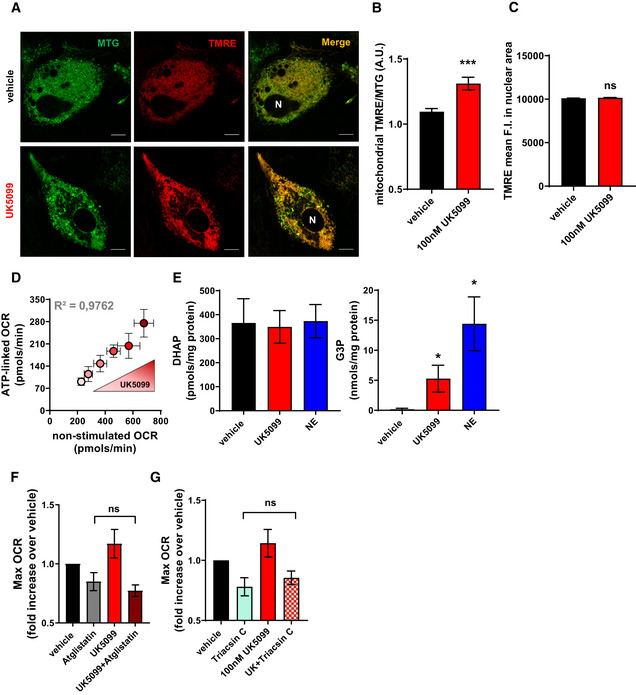
Figure EV5. Effects of UK5099 on ATP demand and lipid cycling.

- Live‐cell super‐resolution confocal imaging of primary brown adipocytes. Cells were stained with mitotracker green (MTG, green) and membrane potential sensitive dye TMRE (red). Cells were treated with vehicle (DMSO) or 100 nM UK5099 for 2 h. N, nucleus. Scale bar = 10 µm.
- Quantification of mitochondrial TMRE fluorescence intensity (F.I.) normalized to mitochondrial MTG F.I. from images shown in (A). Data represent 22‐27 cells from 3 individual experiments. ***P < 0.0001 by Student’s t‐test.
- Quantification of TMRE mean F.I. in nuclear area (N) from images shown in (A). Data represent 15 cells from 3 individual experiments. ns P > 0.05 by Student’s t‐test.
- Effect of increasing UK5099 concentrations (50 nM, 100 nM, 1 µM, 5 µM, 10 µM) on brown adipocytes respiratory rates. Note that the dose‐dependent increase in basal OCR following UK5099 treatment correlates with an increase in ATP‐linked OCR (n = 3 individual experiments).
- Quantification of G3P and DHAP in brown adipocytes treated with vehicle, 100 nM UK5099 or 1 µM norepinephrine (NE) for 24 h (n = 3 individual experiments). *P < 0.05 compared to vehicle by ANOVA.
- Brown adipocytes were treated with either vehicle (DMSO), 100 nM UK5099, 40 µM Atglistatin or Atglistatin in combination with UK5099. Maximal respiratory rates (Max OCR) were calculated after uncoupling by using the proton ionophore FCCP. Data were normalized to vehicle for each individual experiment (n = 3 individual experiments). ns P > 0.05 by ANOVA.
- Brown adipocytes were treated with either vehicle (DMSO), 100 nM UK5099, 5 µM Triacsin C, or Triacsin C in combination with UK5099. Maximal respiratory rates (Max OCR) were calculated after uncoupling by using the proton ionophore FCCP. Data were normalized to vehicle for each individual experiment (n = 4 individual experiments). ns P > 0.05 by ANOVA.
Data information: All data are presented as mean ± SEM.
