Figure 5.

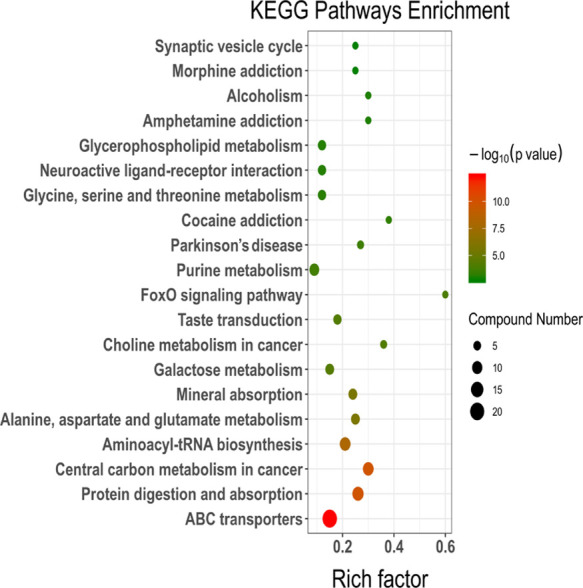
KEGG pathway enrichment results based on metabolite alteration. The size of the dots represents the number of significant metabolites; and the smaller P value indicates that KEGG pathway enrichment is more significant.

KEGG pathway enrichment results based on metabolite alteration. The size of the dots represents the number of significant metabolites; and the smaller P value indicates that KEGG pathway enrichment is more significant.