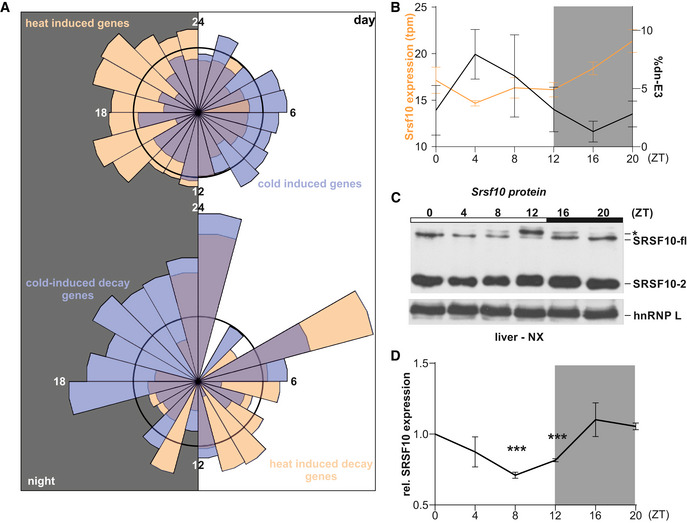
Figure 6. AS‐decay generates GE rhythms in vivo .

- Top: Rose plot visualizing the acrophases (based on rhythmic genes in the liver transcriptome from (Atger et al., 2015)) of genes exhibiting heat‐induced (orange, n = 797) and cold‐induced (blue, n = 828) upregulation of GE in mouse hepatocytes, respectively. Bottom: Acrophases of genes with cold‐induced (blue, n = 55) and heat‐induced (orange, n = 47) poison exon events, respectively. Numbers indicate respective ZT, with the left half representing night (at which mice are active and have an elevated body temperature) and the right half representing day (at which mice are asleep with lower body temperature). The black circles represent expected normal distribution if data would be randomly sampled.
- Correlation of rhythmic Srsf10 expression (orange, left y‐axis) and exon 3 inclusion (black, right y‐axis) in mouse liver samples from the indicated ZTs (n = 4, mean ± SEM). Quantifications were obtained by RNA‐Seq analysis of datasets from (Atger et al., 2015).
- Representative Western blot of SRSF10 protein levels from mouse liver nuclear extracts (NX) from different ZTs. The different SRSF10 variants are highlighted on the right. SRSF10‐fl and SRSF10‐2 are the result of differential last exon usage. hnRNP L was used as a loading control. The asterisks could represent hyperphosphorylated SRSF10‐fl through higher CLK activity during the day.
- Quantification of SRSF10‐fl + SRSF10‐2 relative to ZT0 and hnRNP L (mean of at least 3 mice ± SEM). Student's unpaired t‐test‐derived P values ***P < 0.001.
Data information: Gray areas indicate night time (dark). See also Fig EV5E–G.
