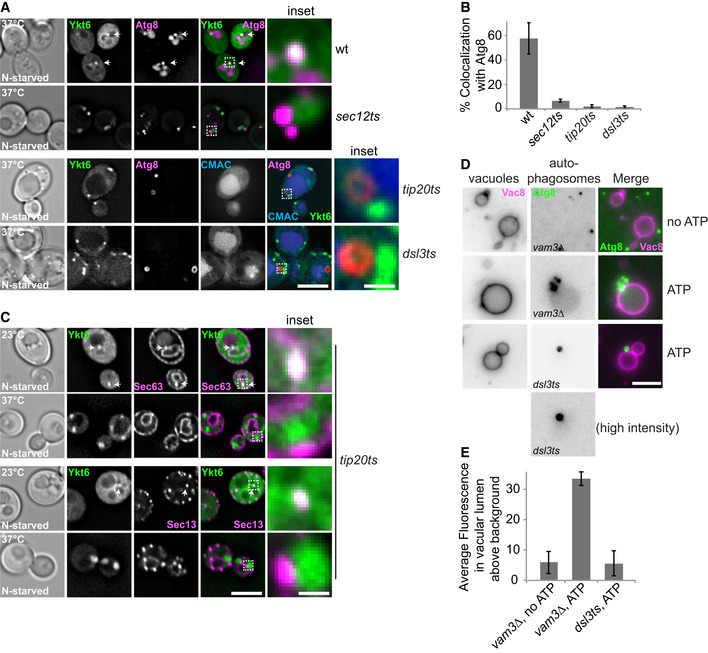
Figure 4. Ykt6 targeting to the PAS requires the Dsl1 complex.

- Effect of Dsl and COPII ts mutants on Ykt6 localization to autophagosomes. Wild‐type and selected ts strains (sec12‐1, tip20‐5, and dsl3‐2) expressing GFP‐tagged Ykt6 and mCherry‐tagged Atg8 were grown at 24°C in SGC for 8 h and then shifted to SG‐N for 2 h at 37°C. Vacuoles were stained by CMAC and analyzed by fluorescence microscopy. Scale bar, 5 μm. Scale bar in inset, 0.7 μm.
- Percentage of Ykt6 puncta colocalizing with Atg8. The data were quantified from (A). Error bars represent standard deviation of three independent experiments. Cells (n ≥ 150) and Atg8 dots (n ≥ 100) were quantified.
- Localization of Ykt6 relative to Sec63 and Sec13 during growth and nitrogen starvation conditions. tip20‐5 cells expressing GFP‐tagged Ykt6 and 3xmCherry‐tagged Sec63 or Sec13 were grown at 24°C in SGC for 8 h and then shifted to SG‐N for 2 h at 24°C or 37°C, and analyzed by fluorescence microscopy. Scale bar, 5 μm. Scale bar of inset, 0.7 μm.
- Effect of dsl mutation on autophagosome–vacuole fusion in vitro. The vam3∆ or dsl ts strain expressing Atg9‐3xFLAG and GFP‐Atg8 was starved for 3 h at 30°C before purifying autophagosomes, which was sufficient to induce the ts phenotype. Vacuoles were isolated from pep4∆ cells expressing Vac8‐3xmCherry and then incubated with autophagosomes at 26°C for 1 h with or without ATP (Gao et al, 2018b). Scale bar, 5 μm.
- Quantification of (D). Error bars represent standard deviation of 3 independent experiments. Fluorescence intensity of GFP‐Atg8 in the vacuolar lumen was quantified by ImageJ using the ROI (region of interest) manager tool. Vacuoles (n ≥ 40) for each experiment were quantified.
