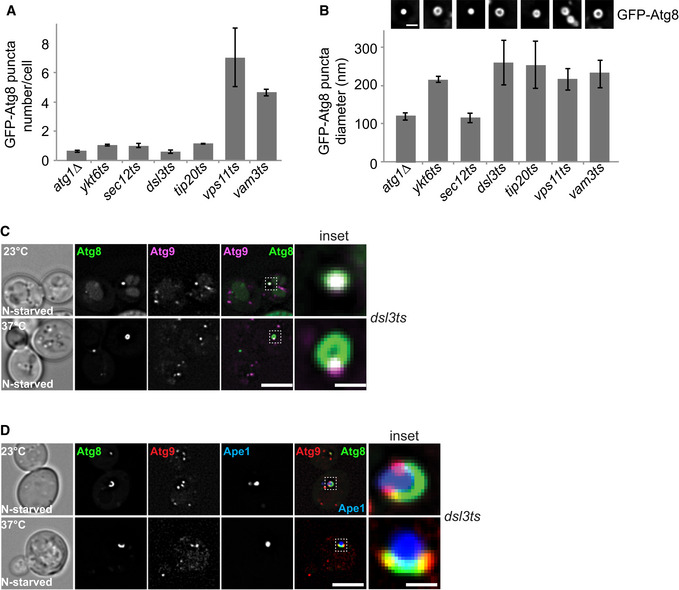
Figure 5. Atg9 and the Dsl1 complex independently contribute to the autophagosome biogenesis.

-
A, BQuantification of size and number of autophagosomes in the indicated ts mutant strains. Error bars represent standard deviation of 3 independent experiments. GFP‐tagged Atg8 in the different mutants were grown at 23°C (ts mutant) or 30°C (atg1∆) in SDC and then shifted to SD‐N for 2 h at 30°C (atg1∆) or 37°C (ts mutant), and analyzed by fluorescence microscopy. Scale bar, 1 μm.
-
CLocalization of Atg8 relative to Atg9 during nitrogen starvation. dsl3 cells expressing mCherry‐tagged Atg9 and carrying a CEN plasmid expressing GFP‐Atg8 were grown at 23°C in SDC and then shifted to SD‐N for 2 h at 24°C or 37°C. Cells were analyzed by fluorescence microscopy. Scale bar, 5 μm. Scale bar for inset is 0.6 μm.
-
CAtg9 localization in dsl3 cells during starvation. dsl3 ts cells expressing mCherry‐tagged Atg9 and carrying a CEN plasmid expressing GFP‐Atg8 and plasmid pRS315‐CUP1pr‐BFP-APE1 were grown in SDC medium containing CuSO4 to induce formation of the giant Ape1 structure and starved for 1 h. Cells were analyzed by fluorescence microscopy. Scale bar, 5 μm. Scale bar for inset is 0.6 μm.
