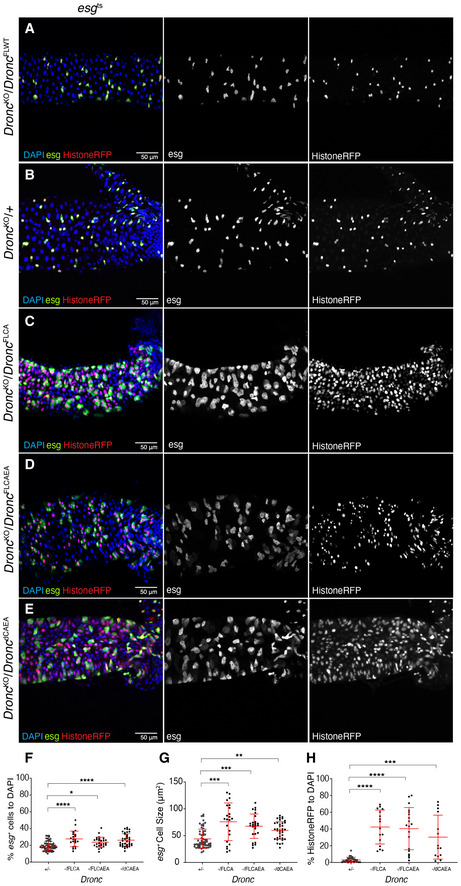
Representative image of a Dronc WT intestine, reared in Oxford Medium under an experimental regime which protects epithelial integrity, showing ReDDM activation for 7 days post‐temperature shift at 29°C. The Flippase‐mediated excision of the FRT‐flanked wild‐type cDNA of Dronc allows the expression of a wild‐type construct of Dronc tagged with Suntag, HA and cherry that does not cause epithelial alterations. DAPI (blue) labels the nuclei in all the figure. Genotype: w
1118; esg‐Gal4 UAS‐CD8‐GFP/+; TubG80ts UAS‐Histone‐RFP Dronc
KO/UAS‐Flippase FRT Dronc‐GFP‐APEX FRT Dronc‐FLWT‐suntag‐HA‐Cherry.
Representative image of a Dronc heterozygous intestine (see full genotype description in Materials and Methods), reared in Oxford Medium under an experimental regime which protects epithelial integrity, showing ReDDM activation for 7 days post‐temperature shift at 29°C; esg expression (green) labels the intestinal progenitor cells, Histone‐RFP (red) is a semi‐permanent marker retained in differentiated cells. Genotype: w
1118; esg‐Gal4 UAS‐CD8‐GFP/+; TubG80ts UAS‐Histone‐RFP Dronc
KO/+.
Representative image of ReDDM labelling showing a Dronc‐mutant intestine, expressing a catalytically inactive form of Dronc (FLCA) in progenitor cells (esg‐positive cells, green) in an Dronc KO genetic background for 7 days post‐temperature shift at 29°C; notice that esg‐labelled cells appear enlarged and guts appear hyperplastic compared with (A). Genotype: w
1118; esg‐Gal4 UAS‐CD8‐GFP/+; TubG80ts UAS‐Histone‐RFP Dronc
KO/UAS‐Flippase FRT Dronc‐GFP‐APEX FRT Dronc‐FLCA‐suntag‐HA‐Cherry.
Representative image of ReDDM labelling showing a Dronc mutant intestine expressing in progenitor cells (esg‐positive cells, green) a catalytically inactive and non‐cleavable form of Dronc (FLCAEA) in an heterozygous KO Dronc mutant genetic background for 7 days post‐temperature shift at 29°C; notice that esg‐labelled cells appear enlarged and guts appear hyperplastic compared with (A). Genotype: w
1118; esg‐Gal4 UAS‐CD8‐GFP/+; TubG80ts UAS‐Histone‐RFP Dronc
KO/UAS‐Flippase FRT Dronc‐GFP‐APEX FRT Dronc‐FLCAEA‐suntag‐HA‐Cherry.
Equivalent to the experiment described in (B) and (C) but in this case esg‐progenitor cells are forced to express a catalytically inactive form of Dronc without the CARD domain (delta‐CAEA, dCAEA). Genotype: w
1118; esg‐Gal4 UAS‐CD8‐GFP/+; TubG80ts UAS‐Histone‐RFP Dronc
KO/UAS‐Flippase FRT Dronc‐GFP‐APEX FRT Dronc‐delta‐CAEA‐suntag‐HA‐Cherry.
Quantification of the percentage of esg‐expressing cells relative to DAPI; note the increase of esg‐expressing cells in the different mutant conditions in comparison with a Dronc heterozygous mutant background (FLCA, ****P < 0.0001; FLCAEA *P = 0.0212; ΔCAEA, ****P < 0.0001) (Quantifications were made using N ≥ 2 biological replicates; Dunnett's multiple comparisons test, +/− n = 61, ‐/FLCA n = 21 ‐/FLCAEA n = 26, ‐/ΔCAEA n = 37). Error bars represent standard deviation of the mean. Quantifications in graph refer to genotypes from A–E.
Quantification of average cell size of esg‐expressing cells (μm2; FLCA, ***P = 0.0002; FLCAEA, ***P = 0.0007; ΔCAEA, **P = 0.0058) (Quantifications were made using N ≥ 2 biological replicates; Dunnett's multiple comparisons test, +/− n = 61, ‐/FLCA n = 23, ‐/FLCAEA n = 26, ‐/ΔCAEA n = 37). Error bars represent standard deviation of the mean. Quantifications in graph refer to genotypes from A–E.
Quantification of the percentage of Histone‐RFP cells without GFP signal relative to DAPI; notice that the number of cells only expressing Histone‐RFP is significantly higher in the FLCA (****P < 0.0001), FLCAEA (****P < 0.0001) and ΔCAEA (***P = 0.0001) genetic backgrounds (Quantifications were made using N ≥ 2 biological replicates; Dunnett's multiple comparisons test, +/− N = 39, ‐/FLCA n = 16, ‐/FLCAEA n = 19, ‐/ΔCAEA n = 14). Error bars represent standard deviation of the Mean. Quantifications in graph refer to genotypes from A–E.

