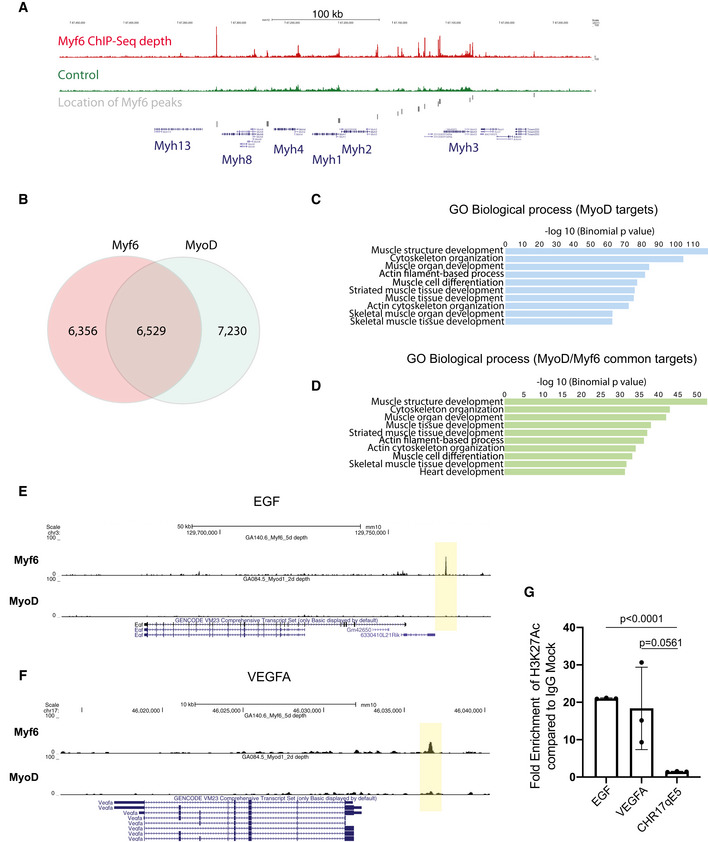
Figure EV2. Myf6 and MyoD share a vast core myogenic genetic network.

-
AEnrichment of Myf6 ChIP‐Seq signal on the myosin heavy chain gene cluster and location of Myf6 peaks.
-
BVenn diagram showing genome‐wide binding sites for MyoD and Myf6 and their overlap in differentiated muscle cells. The overlap is defined as any peaks that have any overlap between the two datasets.
- C
-
DSimilar analysis as in (C) for genes associated with MyoD/Myf6 common peaks. The association rule is based on single nearest gene within 300 kb of the peaks. Within that window the number of peaks associated with more than one gene is minimal for ChIP‐Seq datasets.
- E, F
-
GChIP‐qPCR for H3K27Ac compared with IgG control at the TSS of EGF, VEGFA, and a negative control region of Chromosome 17 qE5. (n = 3 technical replicates), two‐tailed t‐test, error bars = ± SD.
