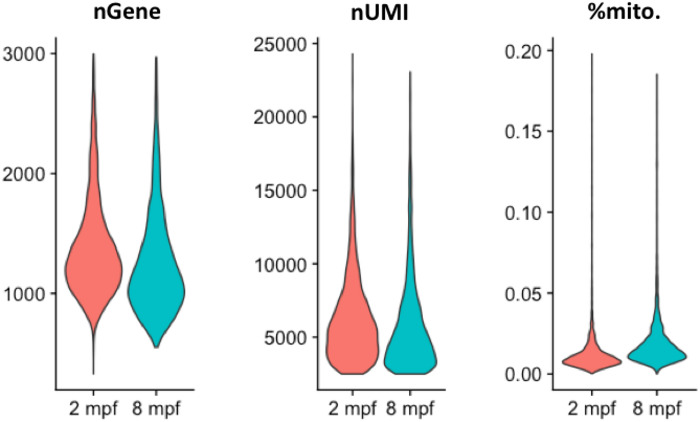
Figure EV2. Quality control parameters for cells present in the zebrafish thyroid gland atlas.

Violin plots depicting the number of genes (nGene), number of unique RNA molecules detected (nUMI—number of Unique Molecule Identifiers) and the percentage of reads mapped onto the mitochondrial genome for the cells profiled in the zebrafish thyroid gland atlas.
