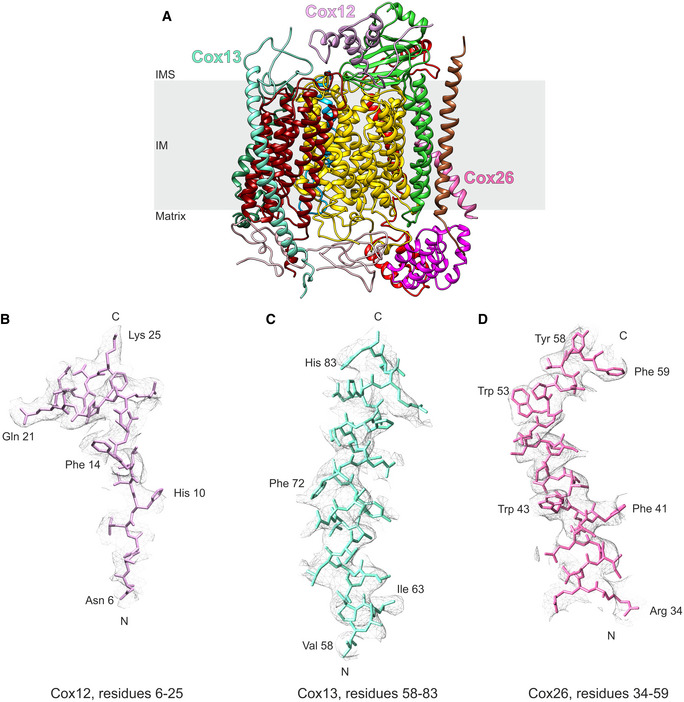
Figure EV2. Example densities of CIV subunits Cox12, Cox13, and Cox26.

-
ARibbon diagram of CIV with Cox12, Cox13, and Cox26 annotated. IM: inner membrane; IMS: intermembrane space.
-
B–DExample densities of Cox12 (B), Cox13 (C), and Cox26 (D) demonstrating parts of the subunits that improved due to the re‐processing of the data set.
