-
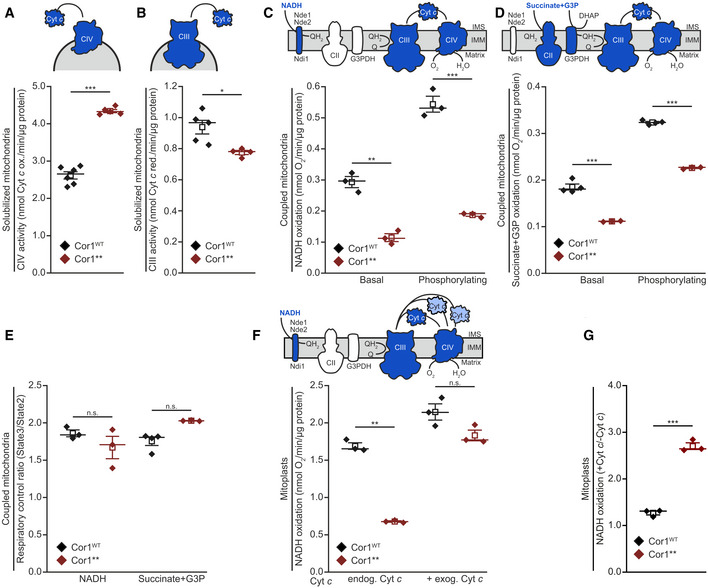
A, B
Spectrophotometric measurement of Cyt c oxidase (CIV; A) and NADH Cyt c reductase (CIII; B) activities in solubilized mitochondrial extracts. Mitochondria were isolated from cells expressing the wild‐type form of Cor1 (Cor1WT) or the mutant Cor1N63A, N187A, D192A, V189A, Y65A, L238A, K240A (Cor1**).
-
C, D
Polarographic measurement of KCN‐sensitive oxygen consumption, driven by NADH (C) or succinate + glycerol‐3-phosphate (G3P; D) in isolated coupled mitochondria of indicated strains. Measurements were performed in the absence (basal respiration) or presence (phosphorylating condition) of ADP.
-
E
Respiratory control ratio calculated from polarographic measurements of KCN‐sensitive oxygen consumption driven by NADH and succinate + glycerol‐3-phosphate (G3P) in isolated coupled mitochondria of indicated strains.
-
F, G
Polarographic measurement of KCN‐sensitive oxygen consumption driven by NADH in mitoplasts in the absence (endog. Cyt c) or presence (+ exog. Cyt c) of exogenous oxidized Cyt c. NADH oxidation (E) and the calculated ratio +Cyt c/−Cyt c of substrate oxidation (F) are visualized.
Data information: Mean (square) ± s.e.m., median (center line) and single data points are depicted. Two‐tailed independent sample
t‐tests were used to analyze data from at least three individual mitochondrial isolations (
n ≥ 3 biological replicates), For (A, B, and F endog. Cyt
c), Welch correction was performed, and for (E Succinate + G3P), a two‐tailed Mann–Whitney
U test was applied. Significances are given as: n.s.: not significant (
P ≥ 0.05), *
P < 0.05, **
P < 0.01, and ***
P < 0.001. A detailed description of statistical analyses performed is given in
Table EV6.