-
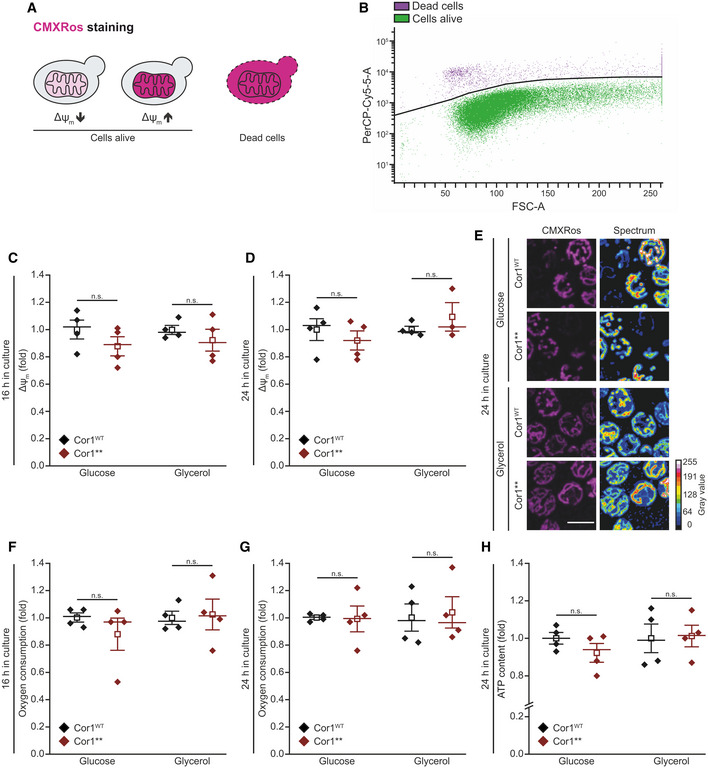
A, B
Scheme of Mitotracker CMXRos staining and gating strategy for flow cytometric analysis. The fluorescence probe is taken up by mitochondria depending on the transmembrane potential (Δψm,). Dead cells accumulate the dye due to a lack of membrane integrity (A) and are excluded from the analysis. The threshold used to separate dead and living cells is shown as black line in (B). The mean fluorescence intensity of cells alive is quantified as a readout for Δψm.
-
C–E
Analysis of Δψm via Mitotracker CMXRos staining of cells expressing the wild‐type form of Cor1 (Cor1WT), as well as the mutant Cor1N63A, N187A, D192A, V189A, Y65A, L238A, K240A (Cor1**). Cells were cultivated in CM media containing indicated carbon sources. Flow cytometric quantification 16 h (C) and 24 h (D) after inoculation are shown, as well as representative confocal micrographs (Z‐projections) after 24 h (E). Normalization in (C) and (D) was performed to Cor1WT cells of the respective medium used.
-
F, G
Oxygen consumption quantified in intact cells. Strains described in (C) were analyzed 16 h (F) and 24 h (G) after inoculation. Normalization of data was performed as stated in (C) to present fold values.
-
H
Cellular ATP content measured from cells described in (C). The measurement was performed with cells cultivated for 24 h in CM media containing the indicated carbon sources. Normalization was performed as stated in (C).
Data information: Mean (square) ± s.e.m., median (center line), and single data points (
n =
4 biological replicates) are depicted. Two‐tailed independent sample
t‐tests were used for statistical analysis. For (C glycerol), Welch correction was performed. Significances are presented as: n.s.: not significant (
P ≥ 0.05). A detailed description of statistical analyses performed is given in
Table EV6. Scale bar in (E) represents 5 μm.

