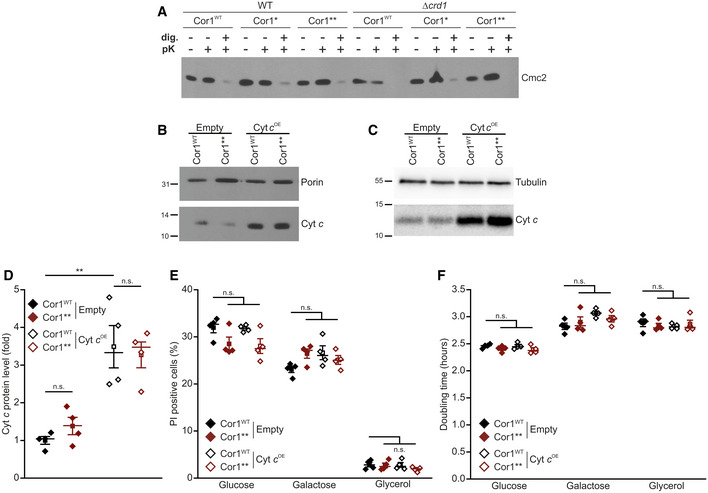
Assays to verify the intactness of the outer mitochondrial membrane. Mitochondria were isolated from strains expressing the wild‐type form of Cor1 (Cor1WT), as well as the mutants Cor1N63A, N187A, D192A (Cor1*) and Cor1N63A, N187A, D192A, V189A, Y65A, L238A, K240A (Cor1**) in wild‐type (WT) background as well as in cells lacking CRD1 (crd1Δ). Intactness of the outer mitochondrial membrane was tested by following the stability of the intermembrane protein Cmc2 1 h after treatment with 6 μg/ml proteinase K (pK). Negative control samples were created by membrane permeabilization with 0.5% digitonin (dig.).
Immunoblot analysis of isolated mitochondria from strains expressing the wild‐type form of Cor1 (Cor1WT) or the mutant Cor1N63A, N187A, D192A, V189A, Y65A, L238A, K240A (Cor1**). Cells either overexpressed cytochrome c (Cyt c
OE) or contained the empty plasmid (Empty) as a control. Blots were probed with antibodies against Cyt c, as well as porin as loading control.
Immunoblot analysis as described in (B) from intact cells. Blots were probed with antibodies against Cyt c, as well as tubulin as loading control.
Densitometric quantification of immunoblots validating overexpression of cytochrome c (Cyt c
OE) in strains expressing either the wild‐type form of Cor1 (Cor1WT) or the mutant Cor1N63A, N187A, D192A, V189A, Y65A, L238A, K240A (Cor1**). The Cyt c signal was normalized to tubulin intensities as a loading control, followed by normalization to Cor1WT strains harboring the empty vector to present fold values.
Flow cytometric quantification of loss of membrane integrity as visualized via propidium iodide (PI) staining of cells described in (D). Cells were cultivated in CM media either containing glucose, galactose or glycerol as carbon source.
Doubling time of strains described in (E).
Data information: Mean (square) ± s.e.m., median (center line), and single data points (
test was applied for statistical analysis, and significances are presented as: n.s.: not significant (
< 0.01. A detailed description of statistical analyses performed is given in
.

