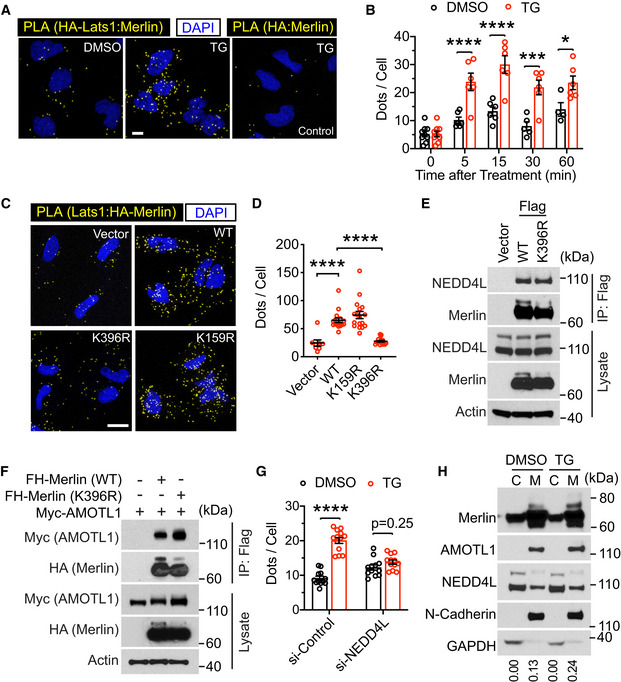
Figure 7. Merlin ubiquitination is important for its interaction with Lats1.

- LN229 cells stably transduced with HA‐Lats1 (two leftmost panels) or vector only (right panel) were treated with DMSO or thapsigargin (TG) and subjected to PLA using HA and Merlin antibodies. Scale bar = 10 μm.
- PLA signals (dots) in each cell from the results in (A) were quantified. Mean ± s.e.m, two‐way ANOVA. *P < 0.05, ***P < 0.001, ****P < 0.0001. Each data point represents an image field containing an average of 10 cells. N = 4–9 images for each condition as indicated. All images were collected from one experiment. Two independent experiments were performed and gave similar results.
- Merlin‐depleted LN229 cells were stably transduced with HA‐tagged wild‐type (WT) Merlin or its mutants. These cells were treated with thapsigargin (TG) for 15 min and subjected to PLA using HA and Lats1 antibodies. Scale bar = 20 μm.
- PLA signals (dots) in each cell from the results in (C) were quantified. Mean ± s.e.m, Ordinary one‐way ANOVA. ****P < 0.0001. Each data point represents an image field containing an average of 10 cells. N Vector = 8, N WT = 16, N K396R = 18, N K159R = 17 images. All images were collected from one experiment. Two independent experiments were performed and gave similar results.
- Merlin‐depleted LN229 cells stably transduced with empty vector, Flag‐tagged wild‐type (WT) Merlin, or its K396R mutant were subjected to immunoprecipitation with a Flag antibody followed by Western blotting.
- HEK293T cells were transfected with indicated proteins and subjected to immunoprecipitation with a Flag antibody. The lysates and immunoprecipitated products were subjected to Western blotting.
- Merlin‐depleted LN229 cells were stably transduced by HA‐tagged Merlin. These cells were then transduced with a pool of four siRNAs against NEDD4L or a scrambled control siRNA and treated with DMSO or thapsigargin (TG). PLA was performed in these cells using HA and Lats1 antibodies, and the PLA signals (dots, showed in Fig EV5E) in each cell were quantified. Mean ± s.e.m, two‐way ANOVA. ****P < 0.0001. Each data point represents an image field containing averagely 10 cells. N = 12 images in all conditions, except for N si‐Control:TG = 13 images. All images were collected from one experiment. Two independent experiments were performed and showed similar results.
- LN229 cells treated with DMSO or thapsigargin (TG) were subjected to cytosolic (C)/membrane (M) fractionation followed by Western blotting. The ratio of mono‐ubiquitinated to native Merlin in each lane was quantified by ImageJ and is shown under the blot.
Source data are available online for this figure.
