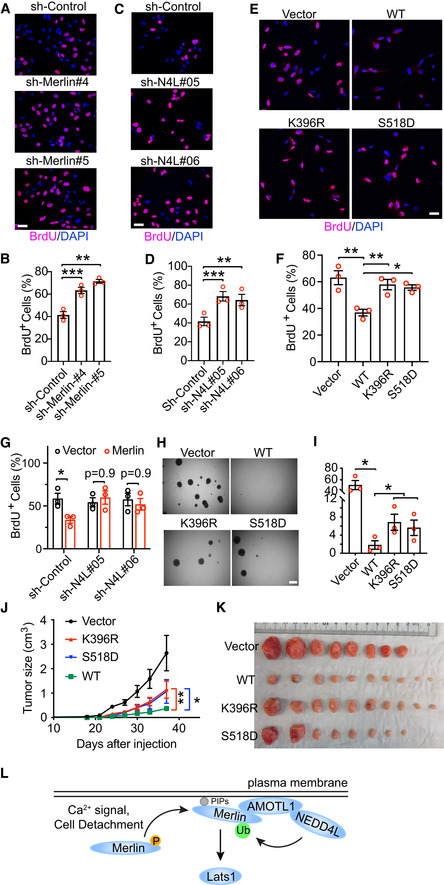
Met5‐A cells stably transduced with the indicated shRNAs targeting Merlin or a scrambled shRNA were subjected to the BrdU incorporation assay. Scale bar = 40 μm.
The percentage of BrdU‐positive cells from (A) was quantified. Mean ± s.e.m, N = 3 biological repeats, paired t‐test. **P < 0.01, ***P < 0.001.
Met5‐A cells stably transduced with the indicated shRNAs targeting NEDD4L or a scrambled shRNA were subjected to the BrdU incorporation assay. Scale bar = 40 μm.
The percentage of BrdU‐positive cells from (C) was quantified. Mean ± s.e.m, N = 3 biological repeats, paired t‐test. **P < 0.01, ***P < 0.001.
Meso‐33 cells transduced with vector or the indicated Merlin forms were subjected to the BrdU incorporation assay. Scale bar = 40 μm.
The percentage of BrdU‐positive cells from (E) was quantified. Mean ± s.e.m, N = 3 biological repeats, ordinary one‐way ANOVA. *P < 0.05, **P < 0.01.
Meso‐33 cells stably transduced with the indicated shRNAs targeting NEDD4L or a scrambled shRNA were then transduced with vector or Merlin prior to the BrdU incorporation assay. The percentage of BrdU‐positive cells was quantified. Mean ± s.e.m, N = 3 biological repeats, two‐way ANOVA.
FC‐1801 cells stably transduced with vector or the indicated Merlin forms were subjected to the sphere formation assay. Scale bar = 500 μm.
The number of spheres in each well from (H) was quantified. Mean ± s.e.m, N = 3 biological repeats, paired t‐test. **P < 0.05.
FC‐1801 cells stably transduced with vector or the indicated Merlin forms were subcutaneously injected into nude mice. Tumor sizes in each group were quantified and plotted. Mean ± s.e.m, N
Vector = 8 mice, N
WT = 10 mice, N
K396R = 10 mice, N
S518D = 8 mice, two‐way ANOVA. P values of the last measurements (day 37 after injection) are shown. *P < 0.05, **P < 0.01.
Tumors were collected when the vector group in (J) reached the end point (day 37 after injection).
A proposed model showing how Merlin is activated to induce Lats1 phosphorylation on the plasma membrane.

